
Doing more with Dashboards
For reports and recurring updates, start with Enterpret Agent and scheduled Agent automations. Set up daily reports, weekly summaries, or scheduled digests delivered to Slack or email. Add connectors when you need external context or supported actions. Use this guide's Dashboard controls when you specifically need that saved view or its subscription.
How to add Quantify to a Dashboard
There are two ways to add Quantify to a Dashboard. You can add an existing Quantify or create a new one.
Add an existing Quantify
Click the Add button in the top-right corner or at the center of the screen.
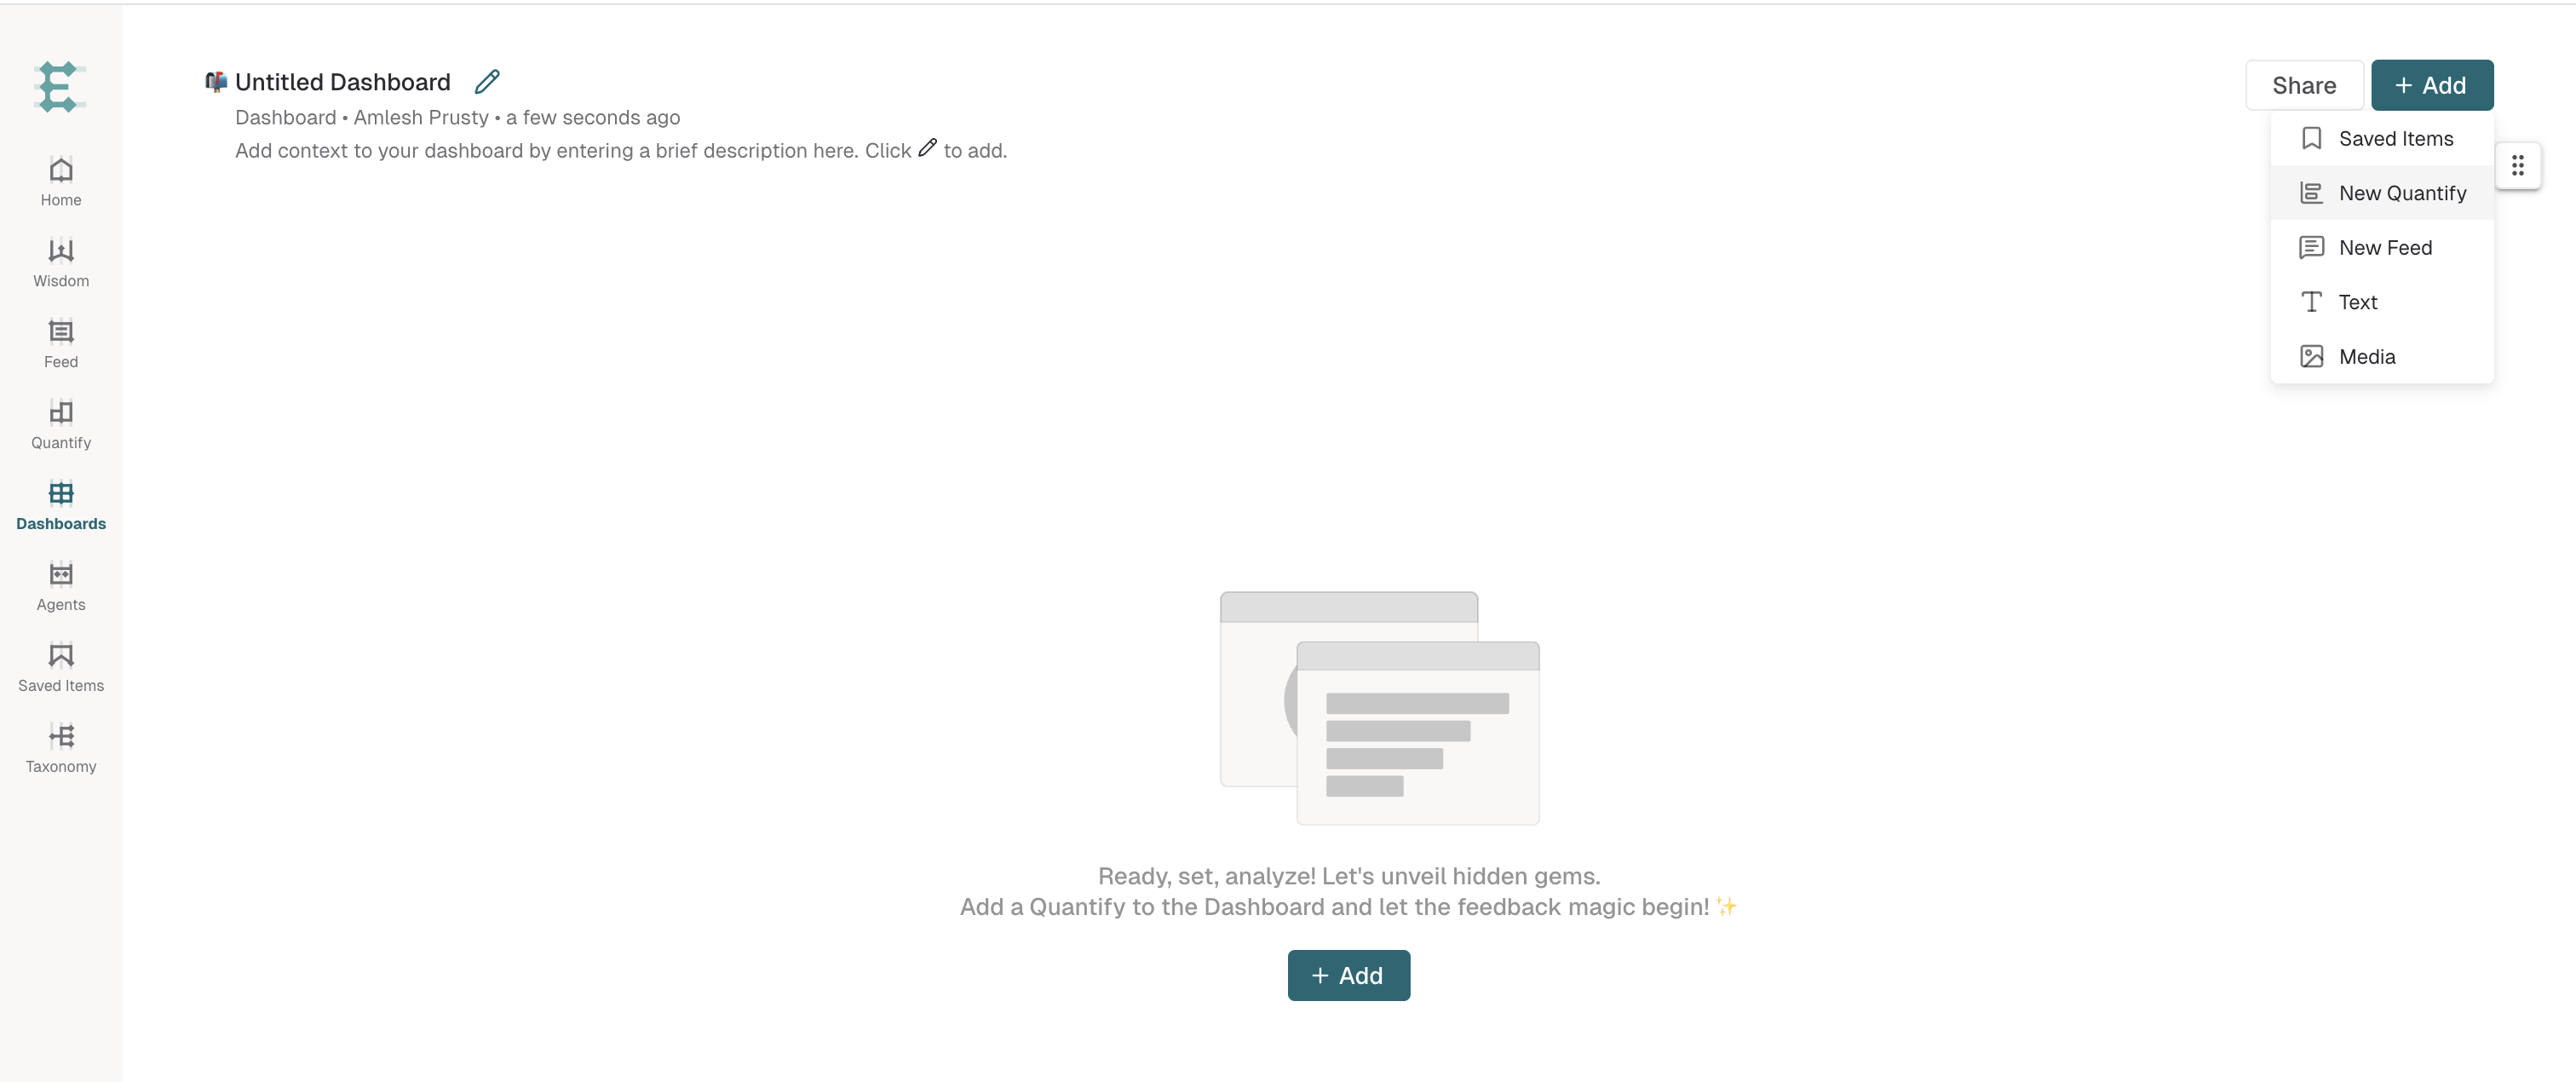
Select Quantify after selecting Saved Items from the expansion panel.
Choose an existing Quantify from the list and click Add to Dashboard.
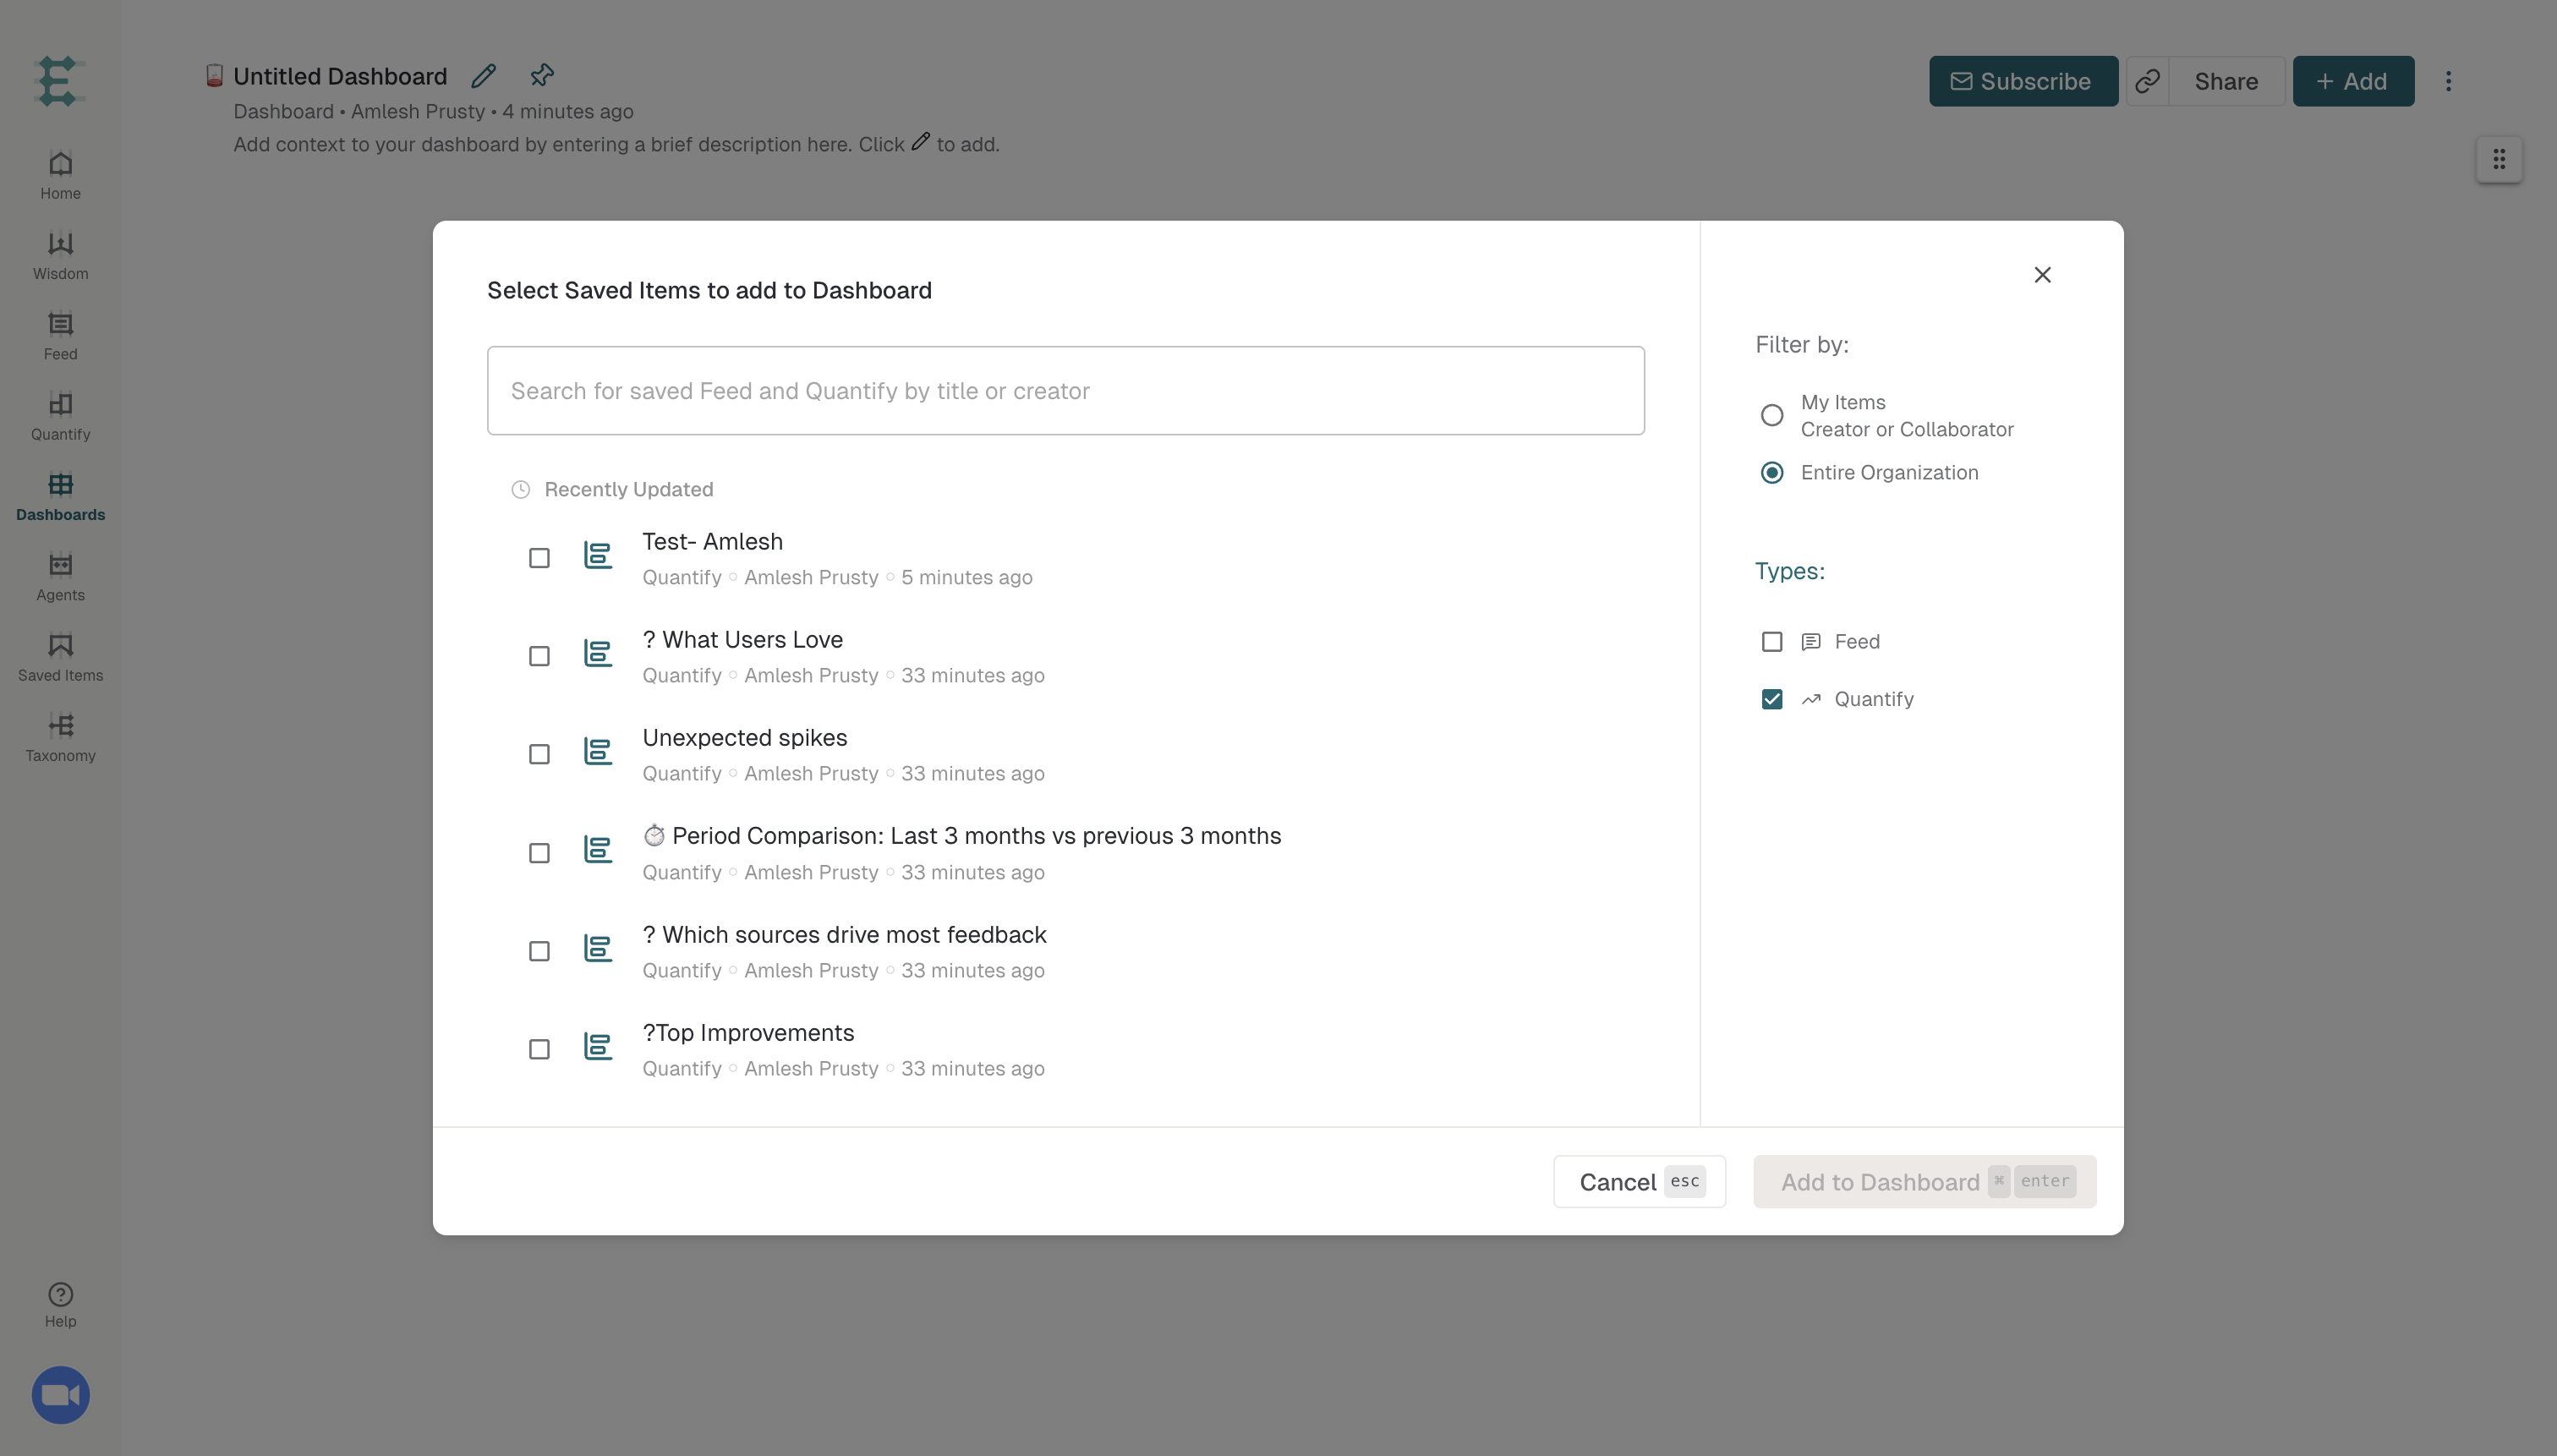
The Quantify chart is now added to your Dashboard.
Add a new Quantify
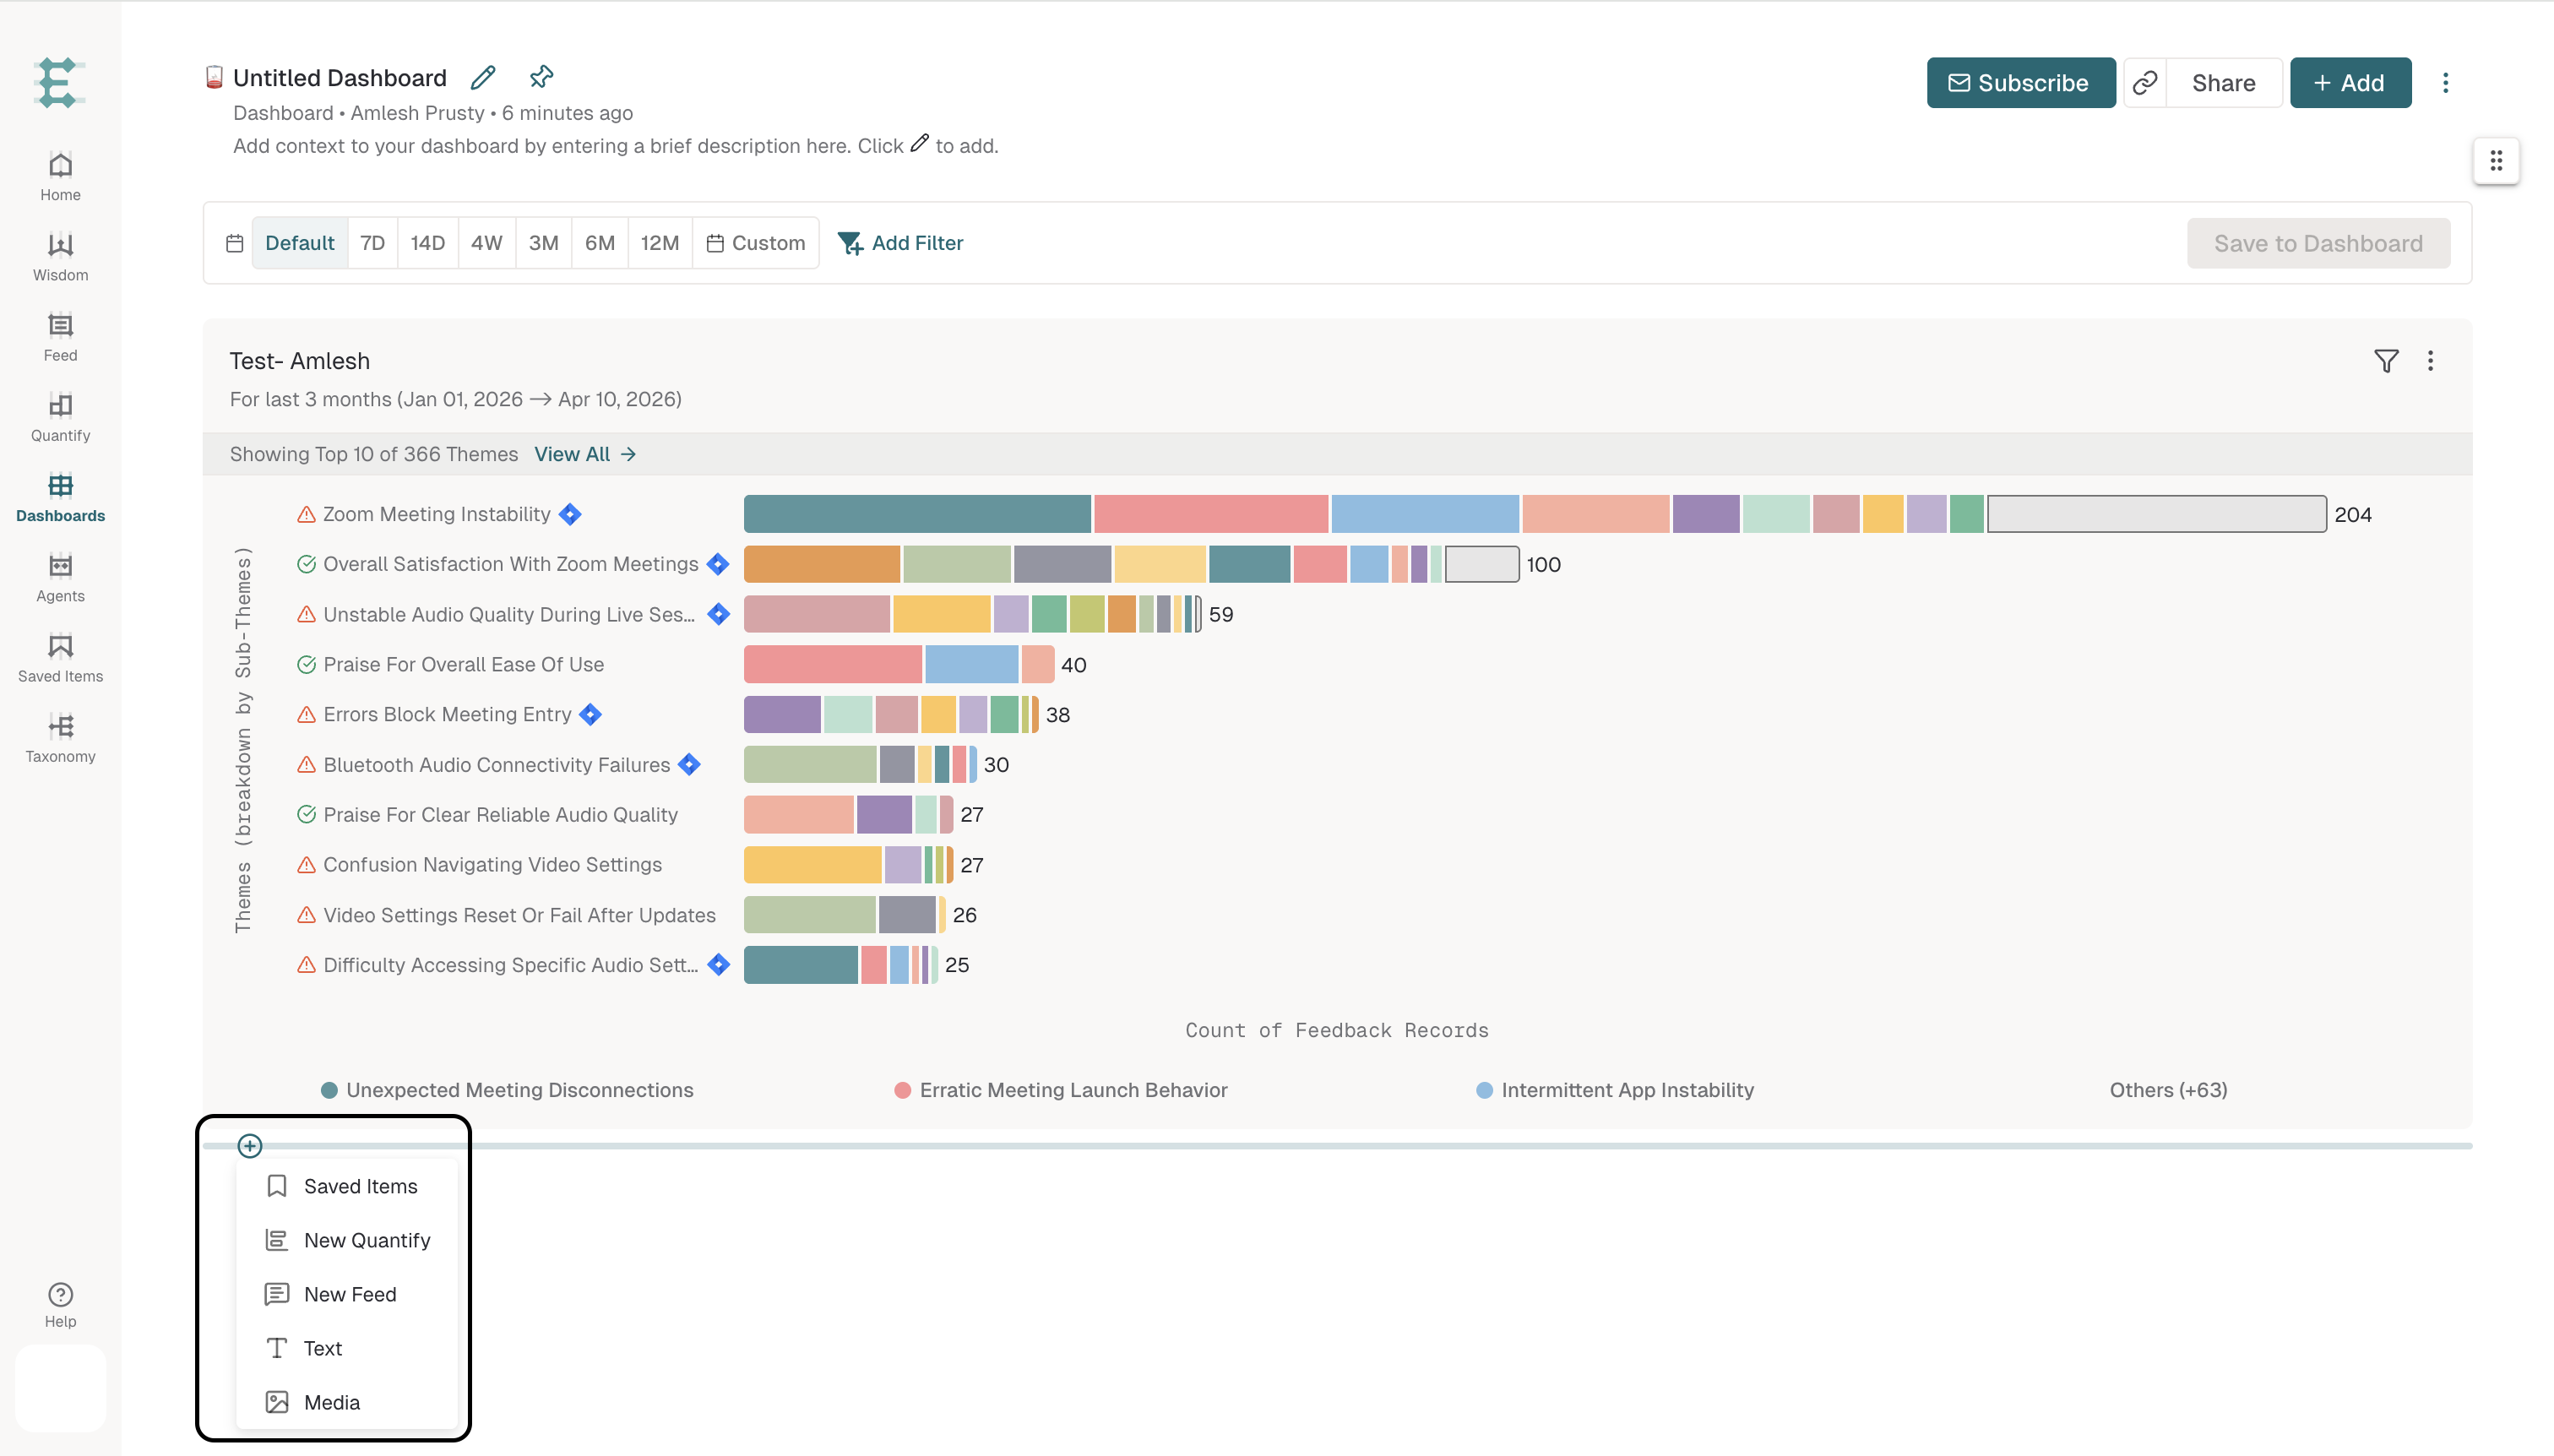
Click the Add button in the top-right corner or at the center of the screen.
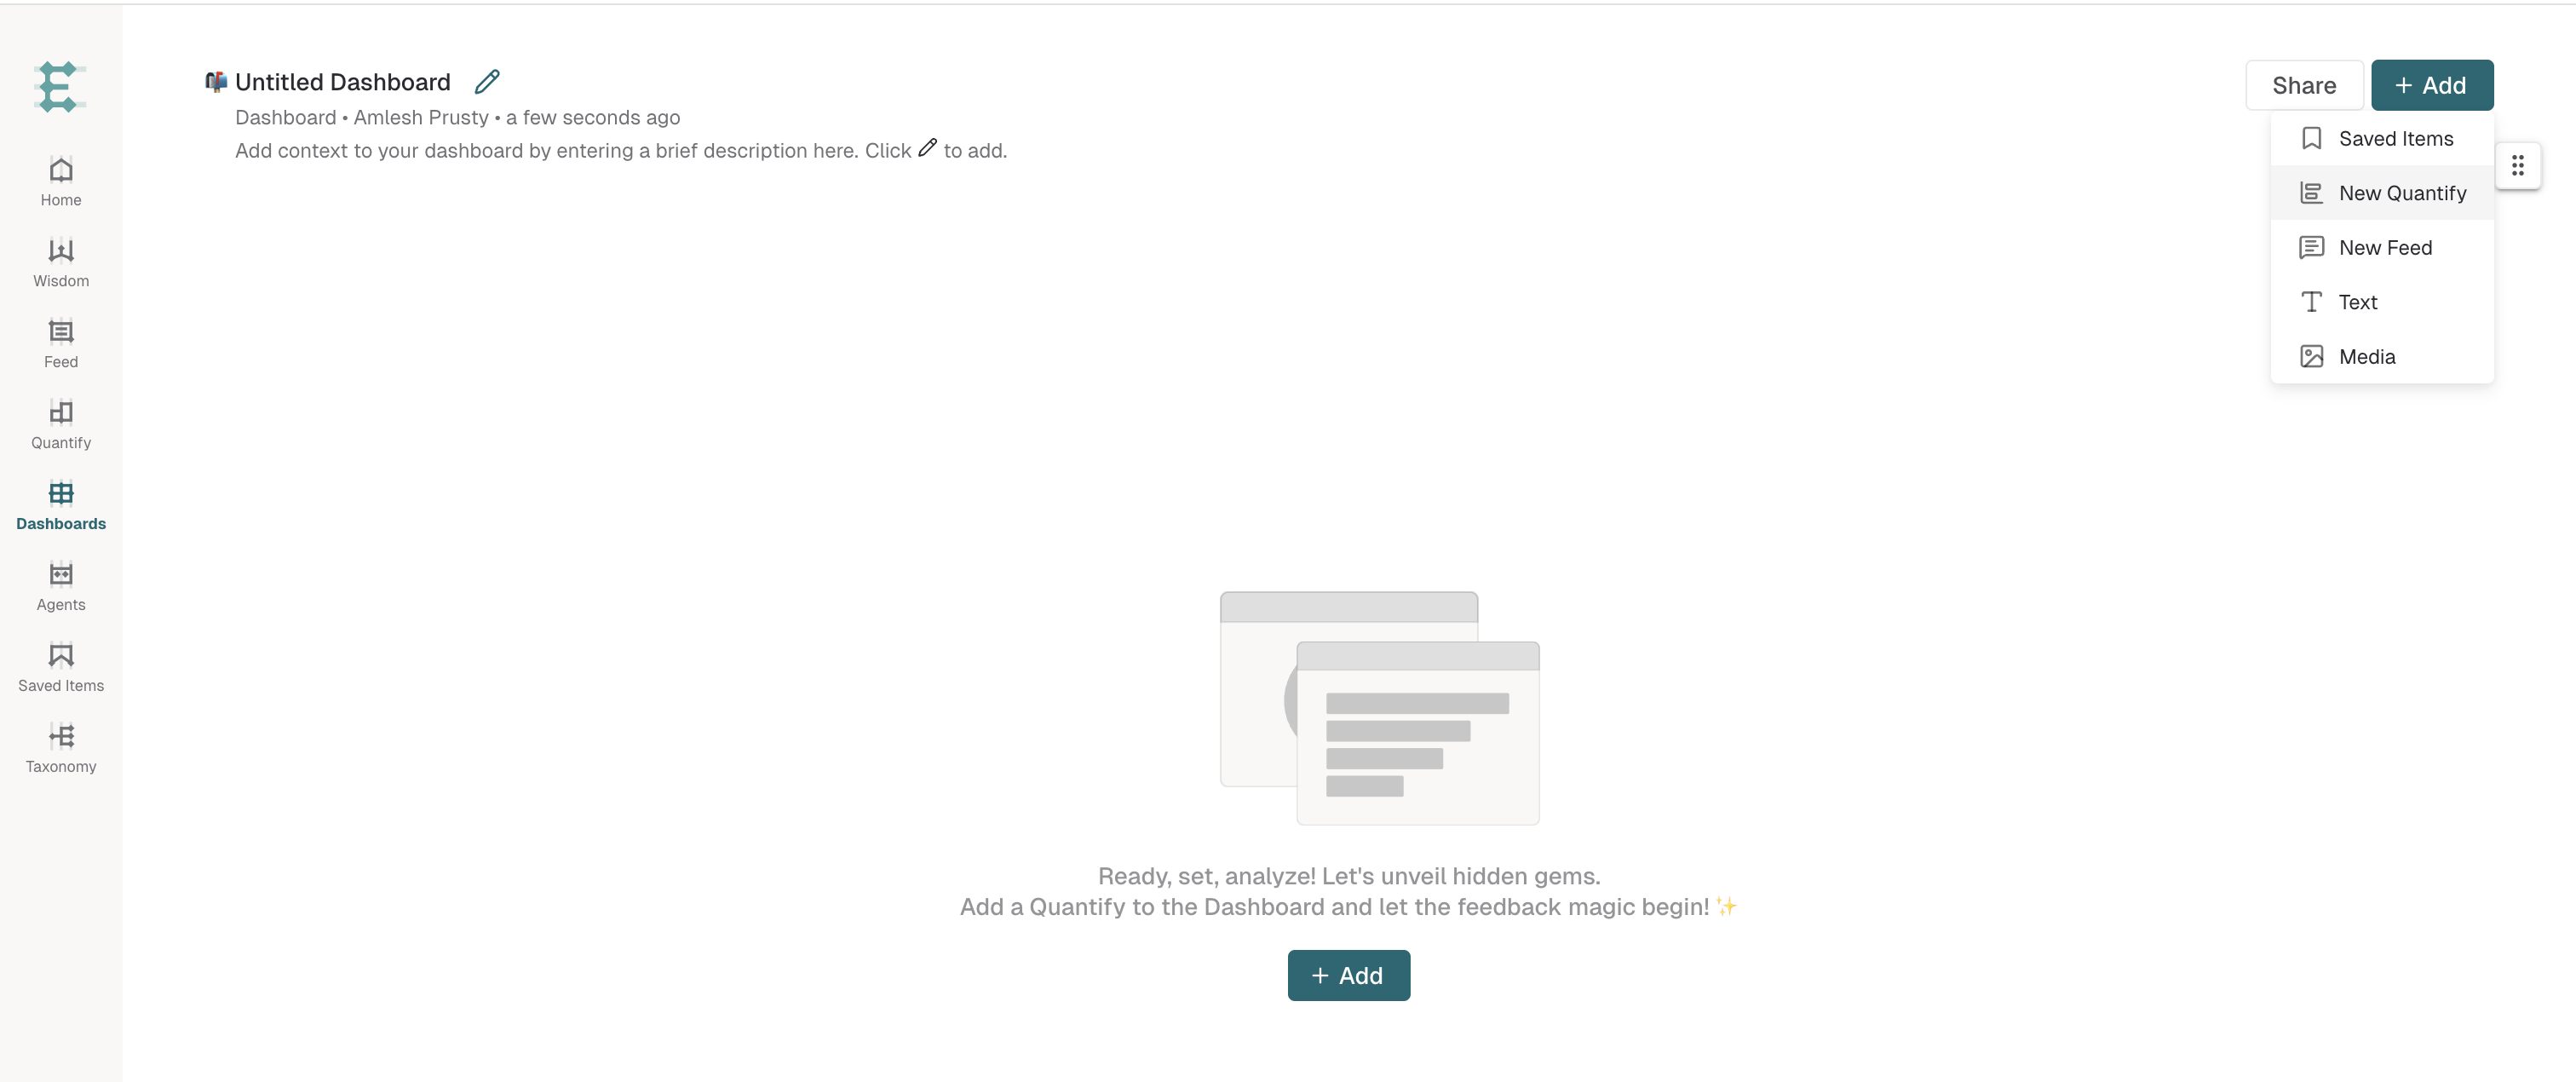
Select New Quantify from the expansion panel.
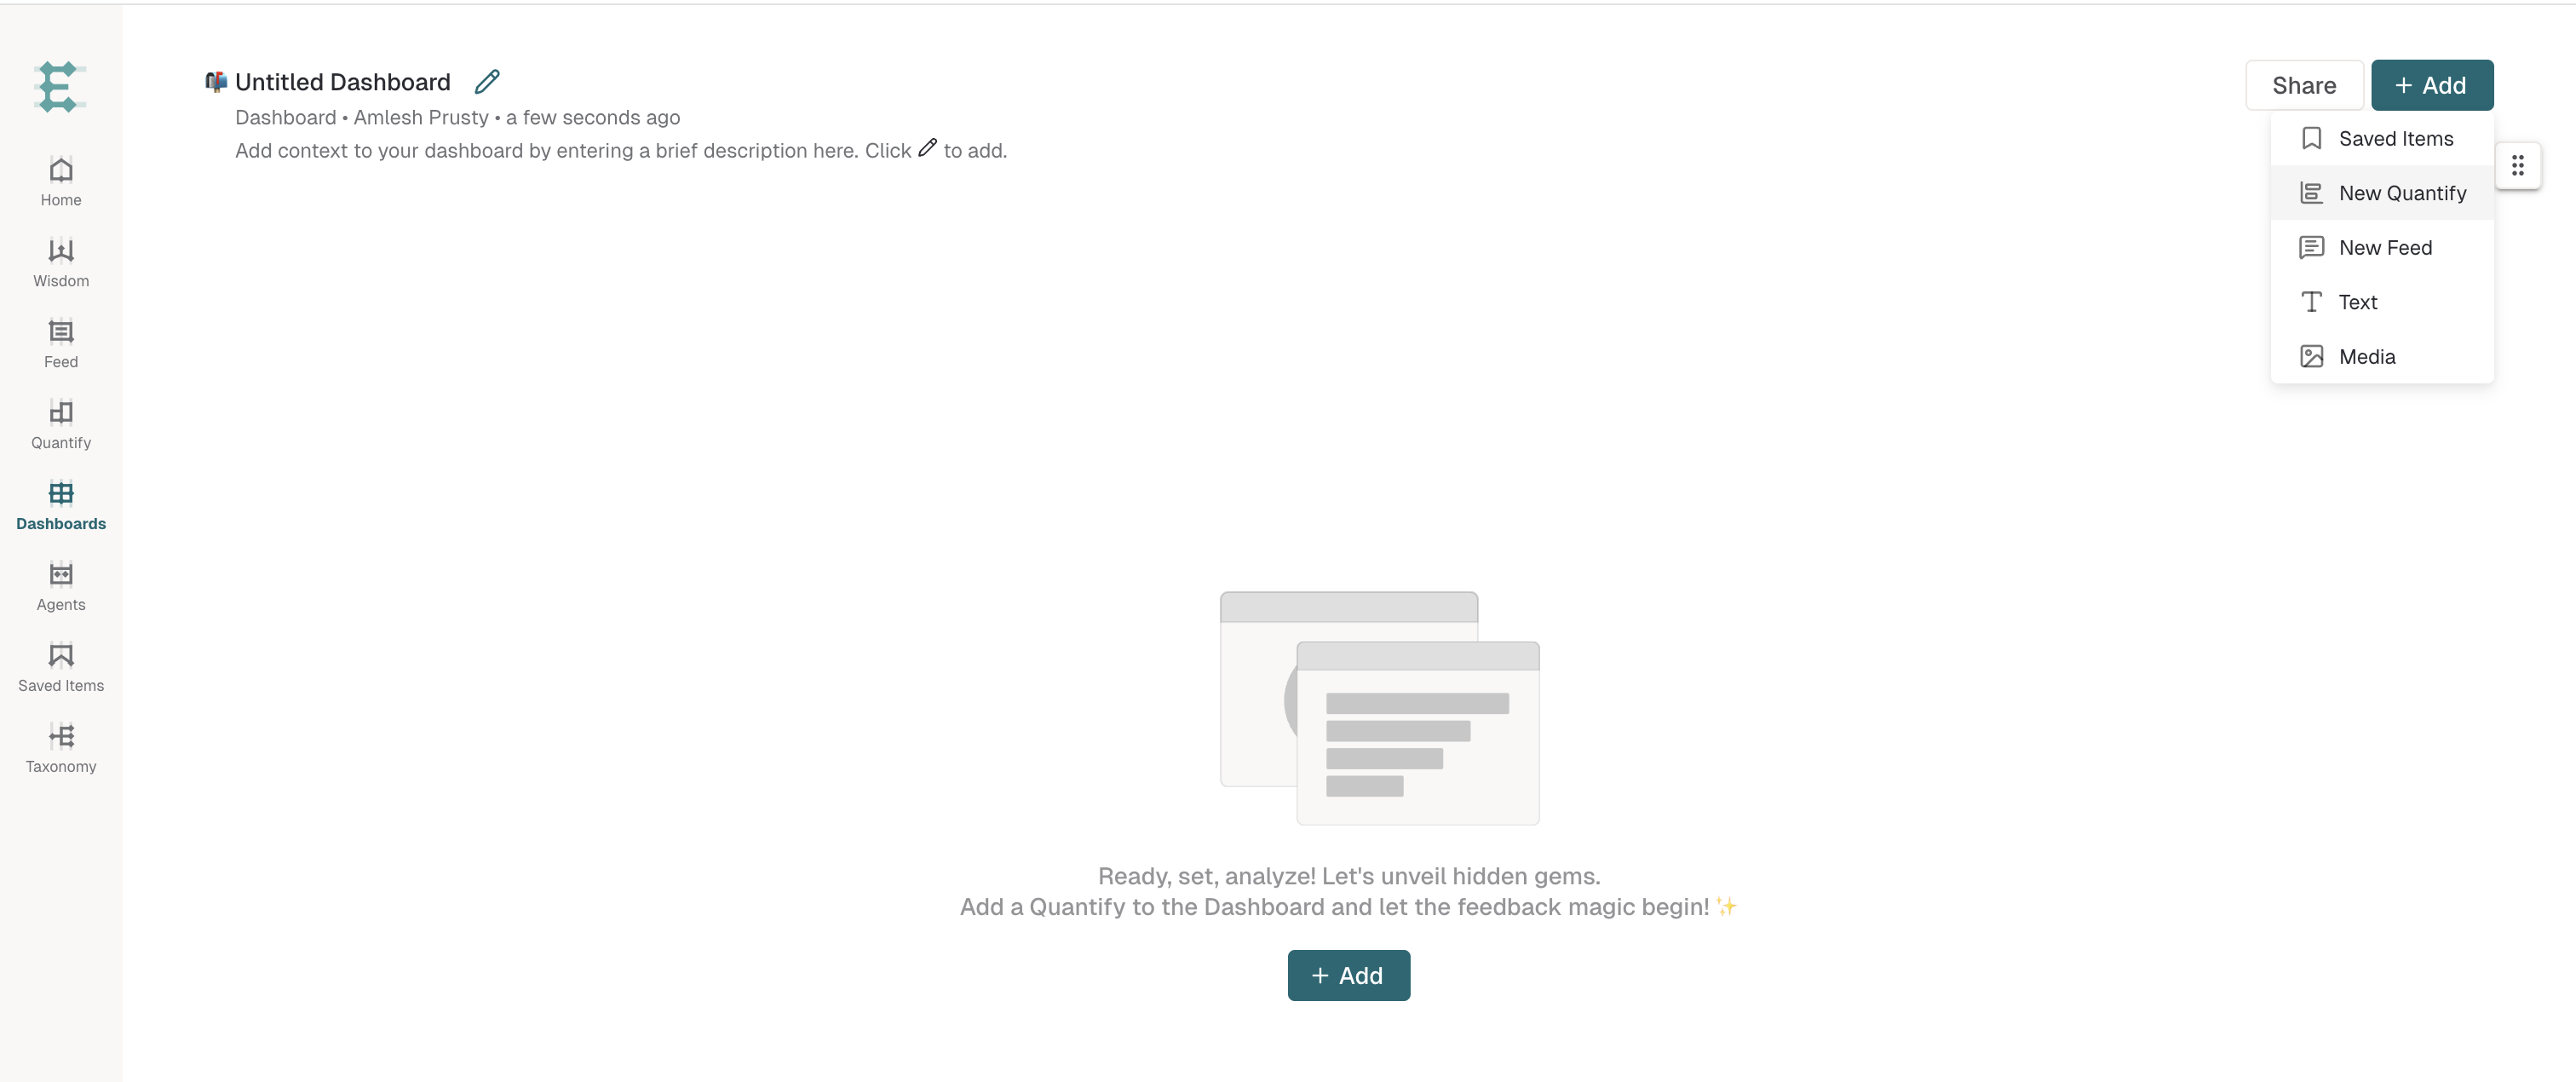
Create a new Quantify. For detailed instructions, see the Quantify guide.
Click Save & Add to Dashboard.
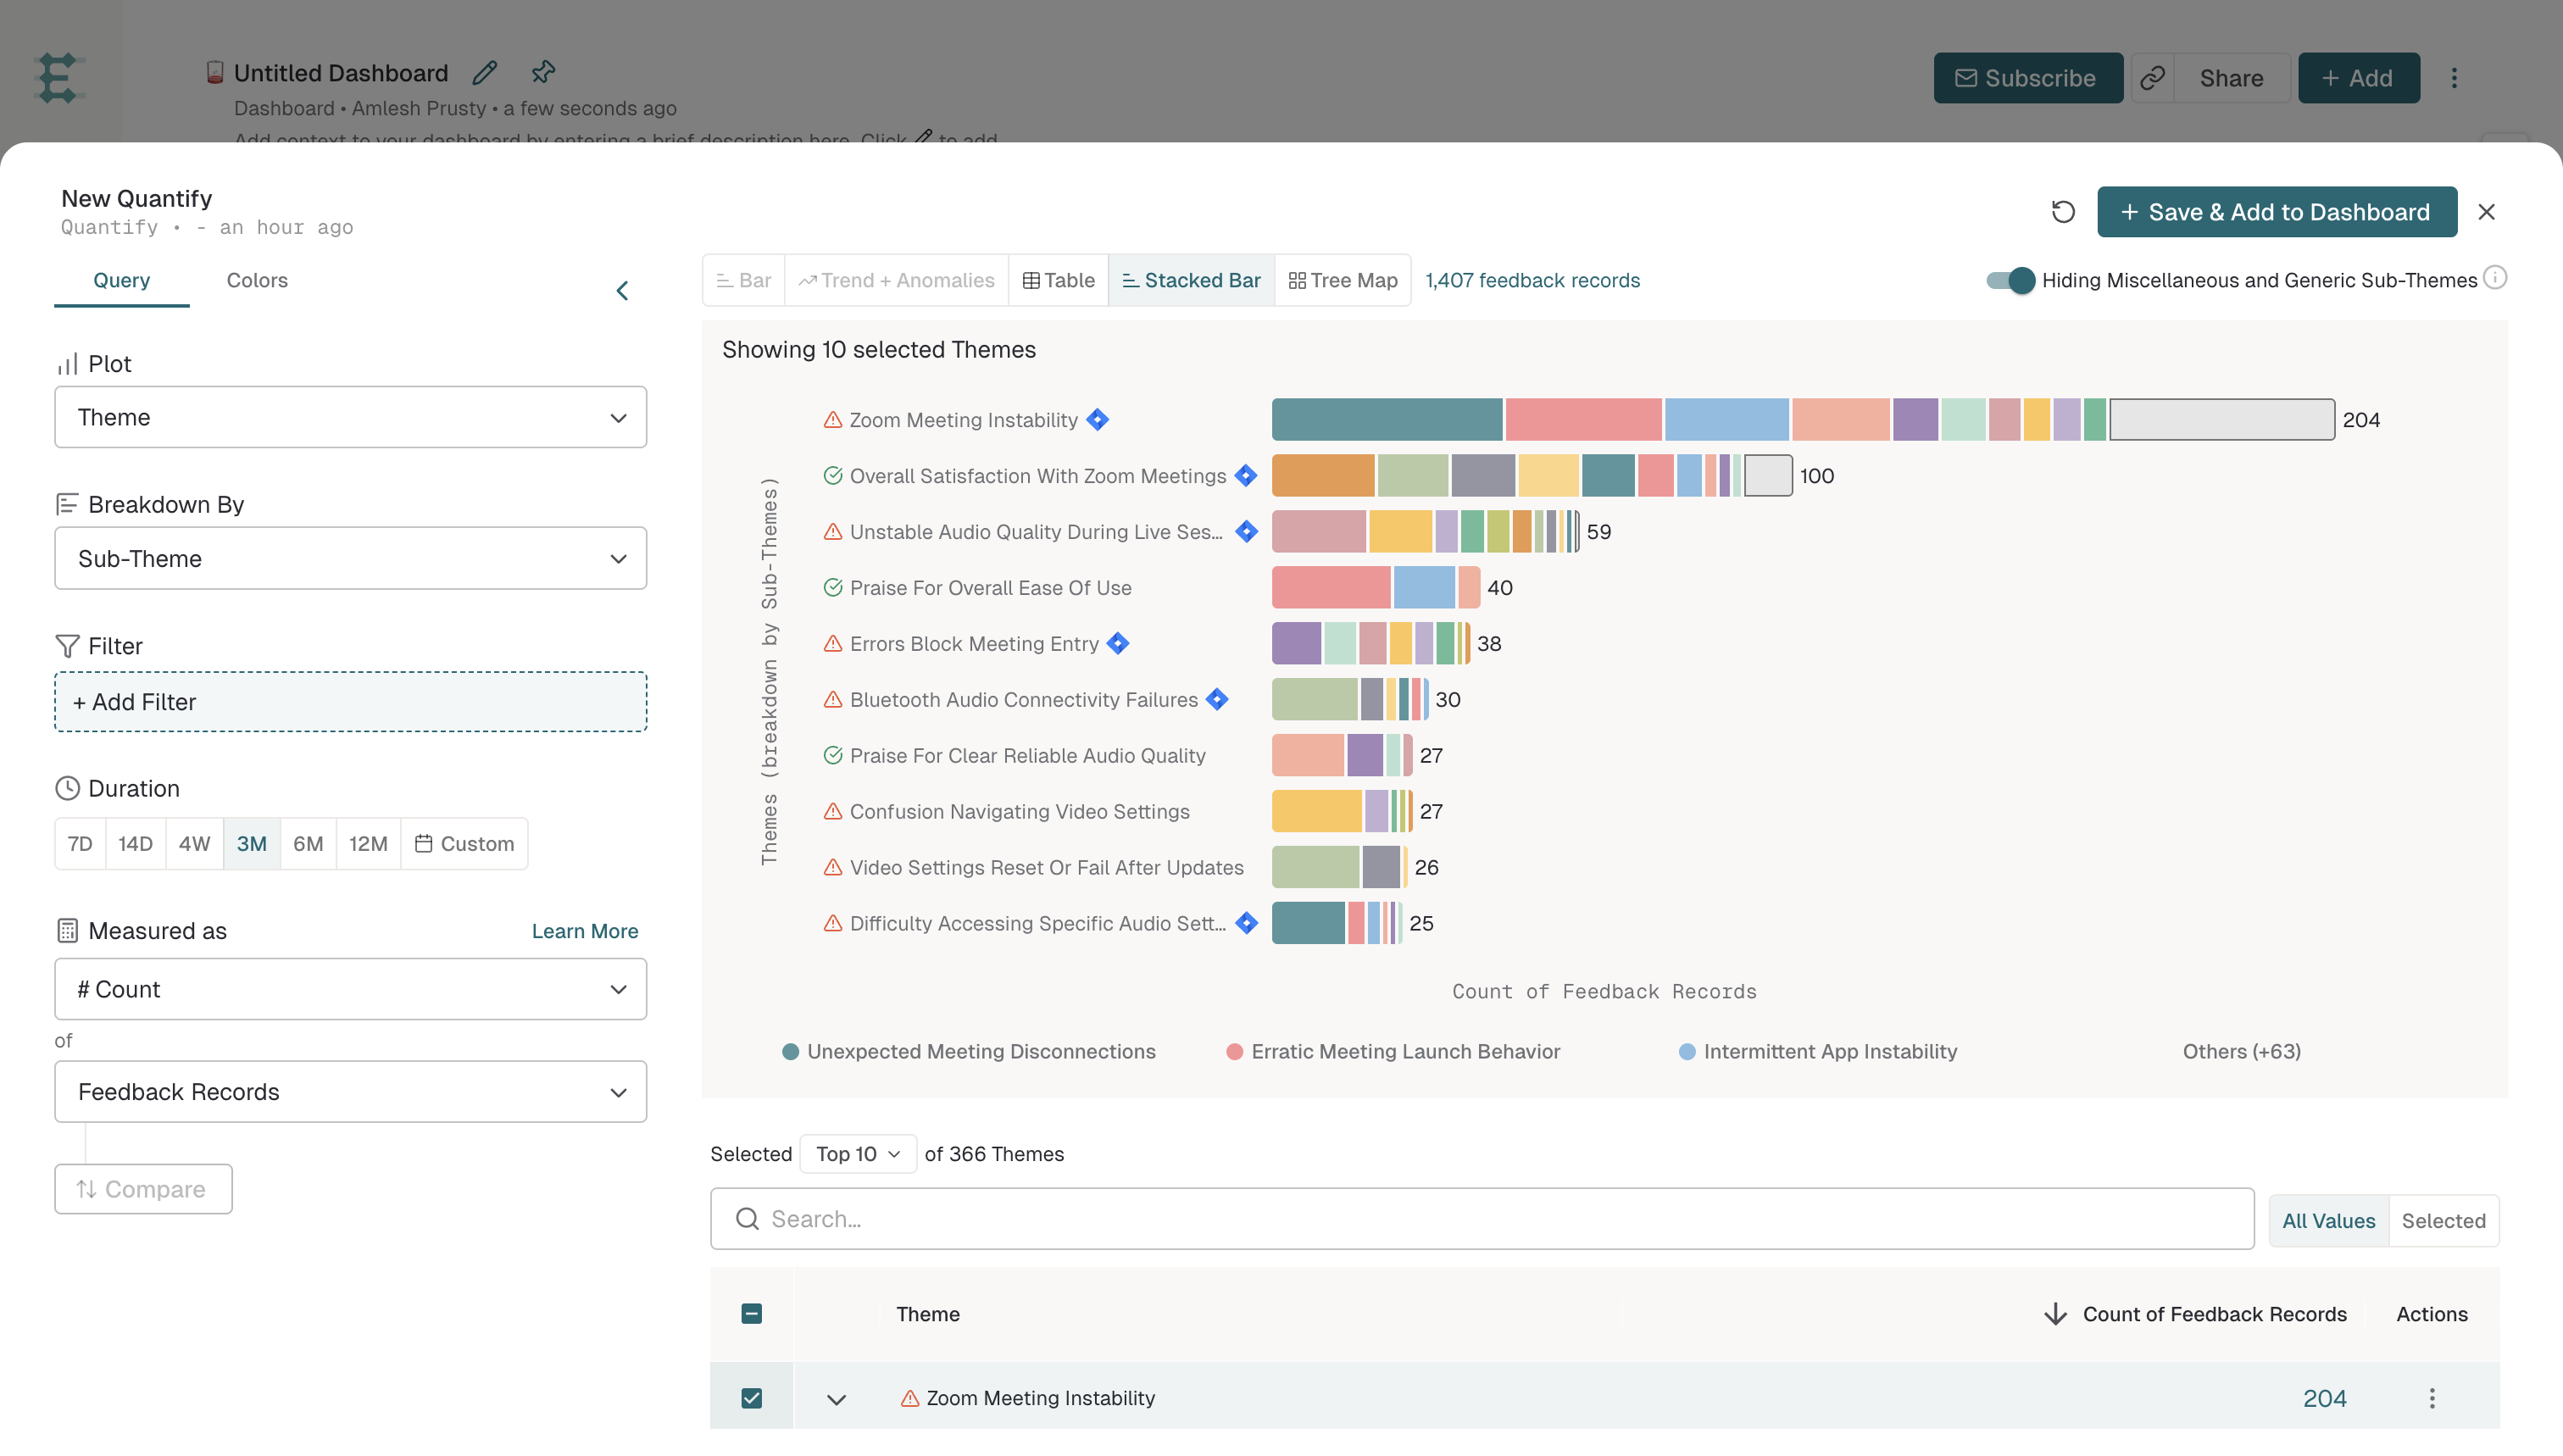
Enter a descriptive name for the Quantify.
Click Save Quantify & Add.
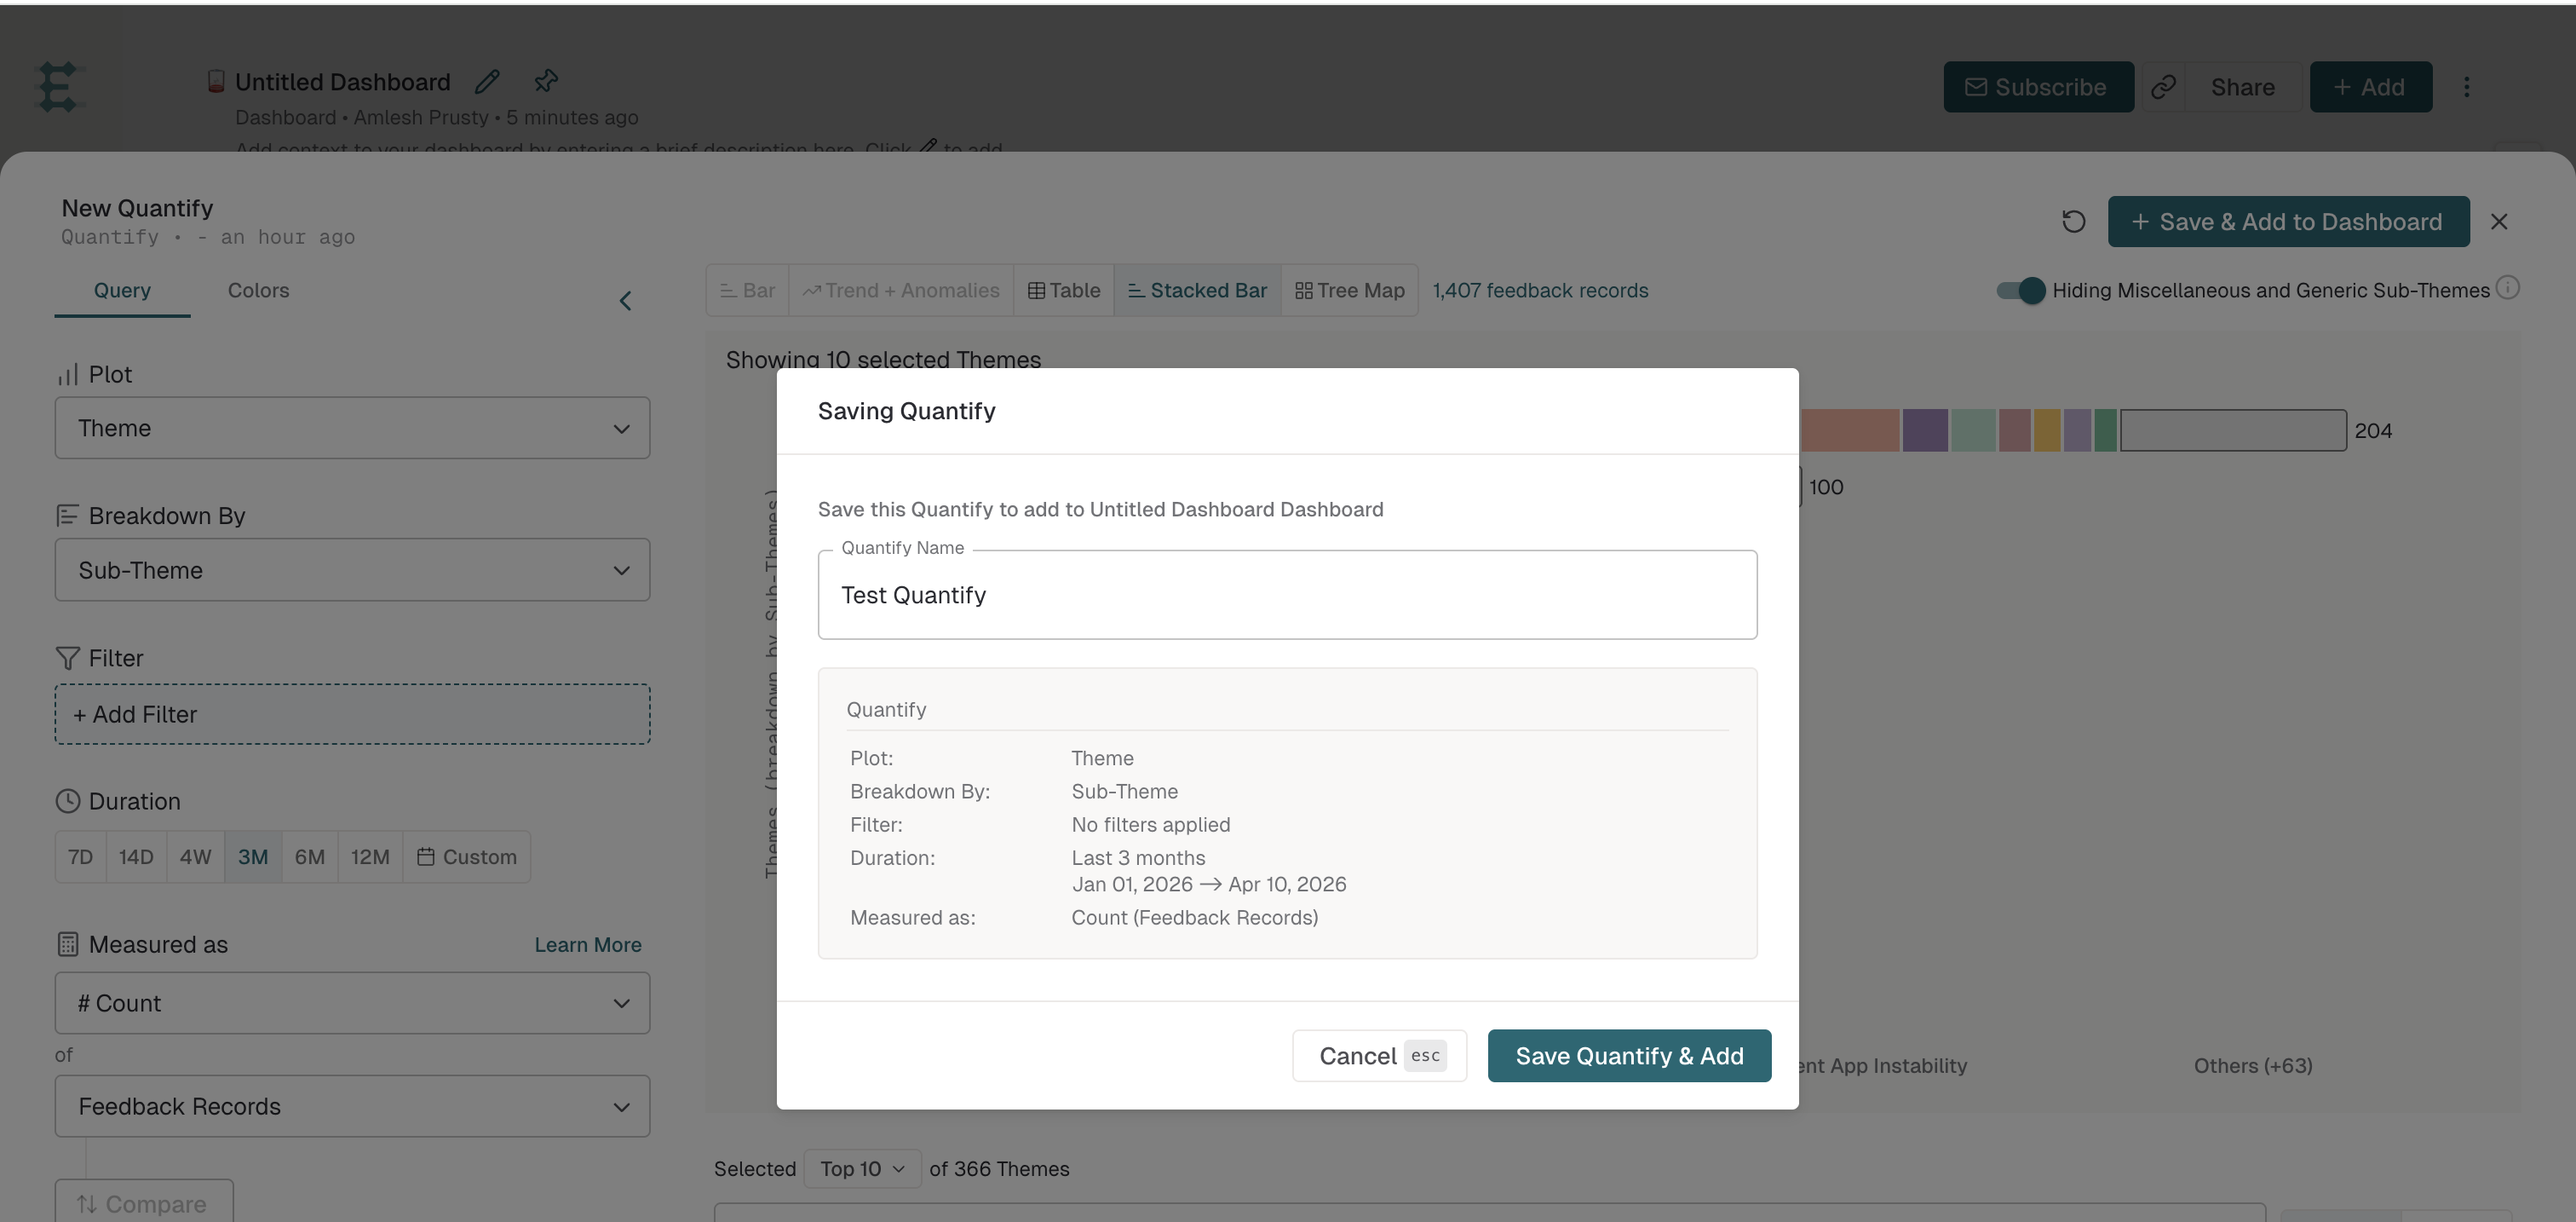
The new Quantify is now visible in your Dashboard.
There is another way to add Quantify after you've added some already: Click + Add Content at the bottom of the Dashboard screen.
How to add text to a Dashboard
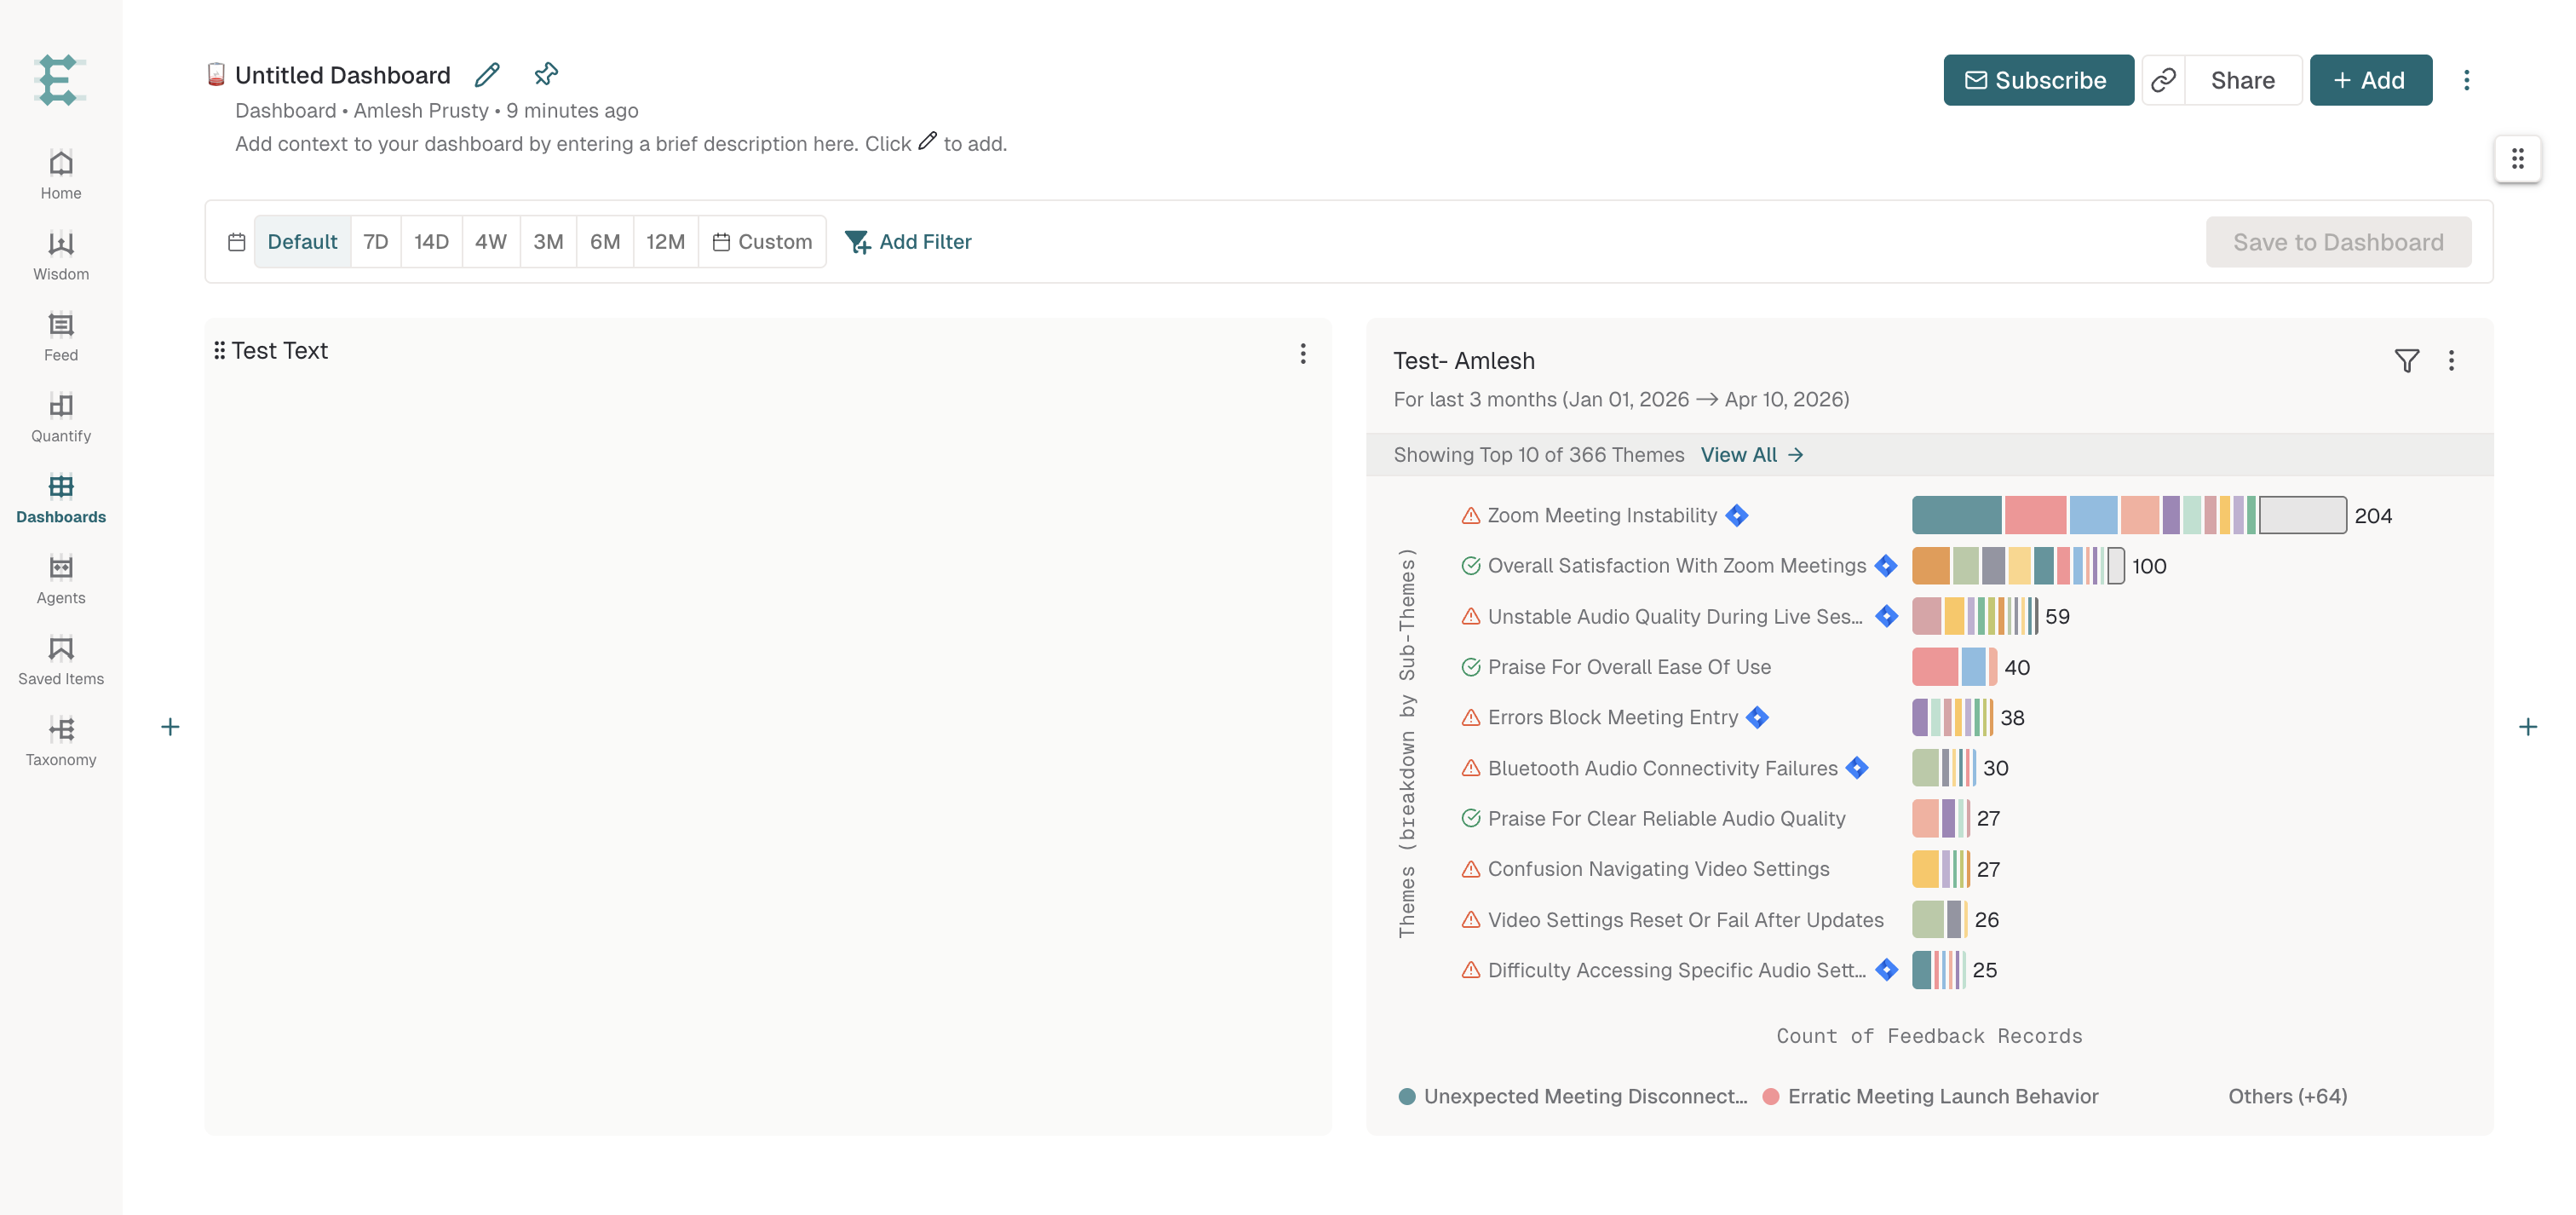
You can add text blocks to Dashboards for notes, explanations, or headings.
Click the Add button at the top-right of the screen, or click any + icon on the sides of Quantify charts. A panel opens. Click the Text option.

A text box is inserted into your Dashboard. Use the formatting options to add headings, bold text, italic, quotes, code, or other styles.

Adjust the location of the text block by dragging it.
How to set up Dashboard level filters
Filters on Dashboards allow you to apply filters to multiple charts simultaneously, streamlining your feedback analysis. They also enable you to create versatile, customizable Dashboard templates for better team collaboration.
Open one of your existing Dashboards.
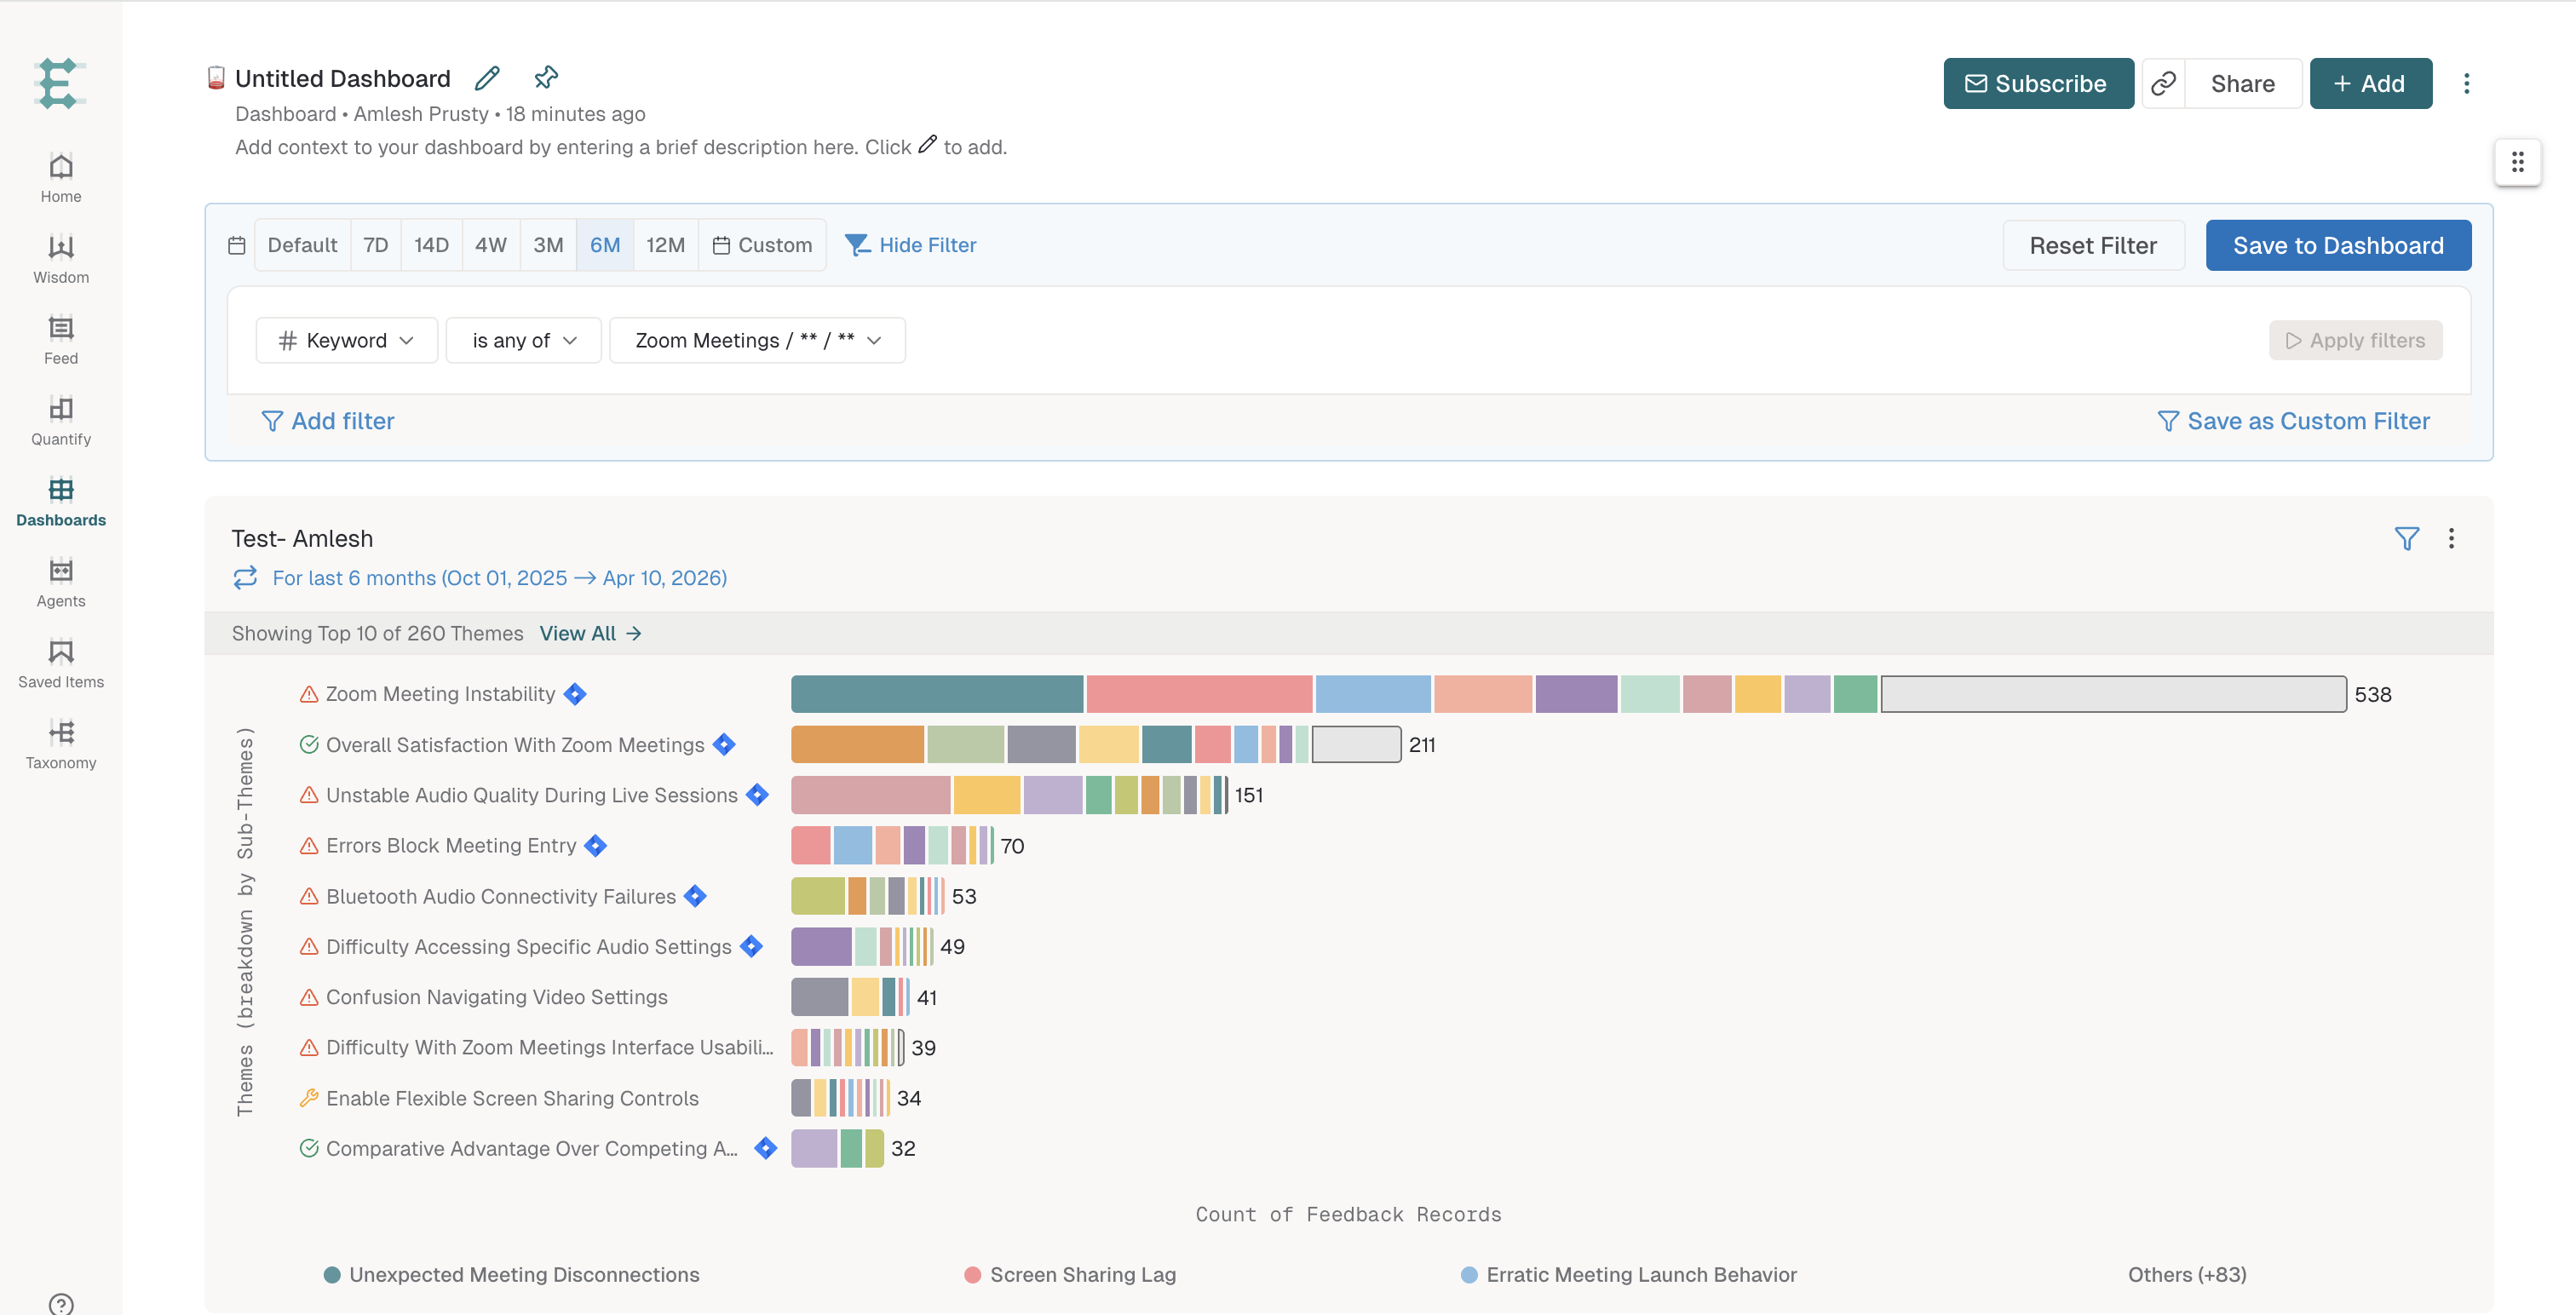
Choose a time-based filter by selecting from the available time ranges.

To add more filters, click the Add Filter button.
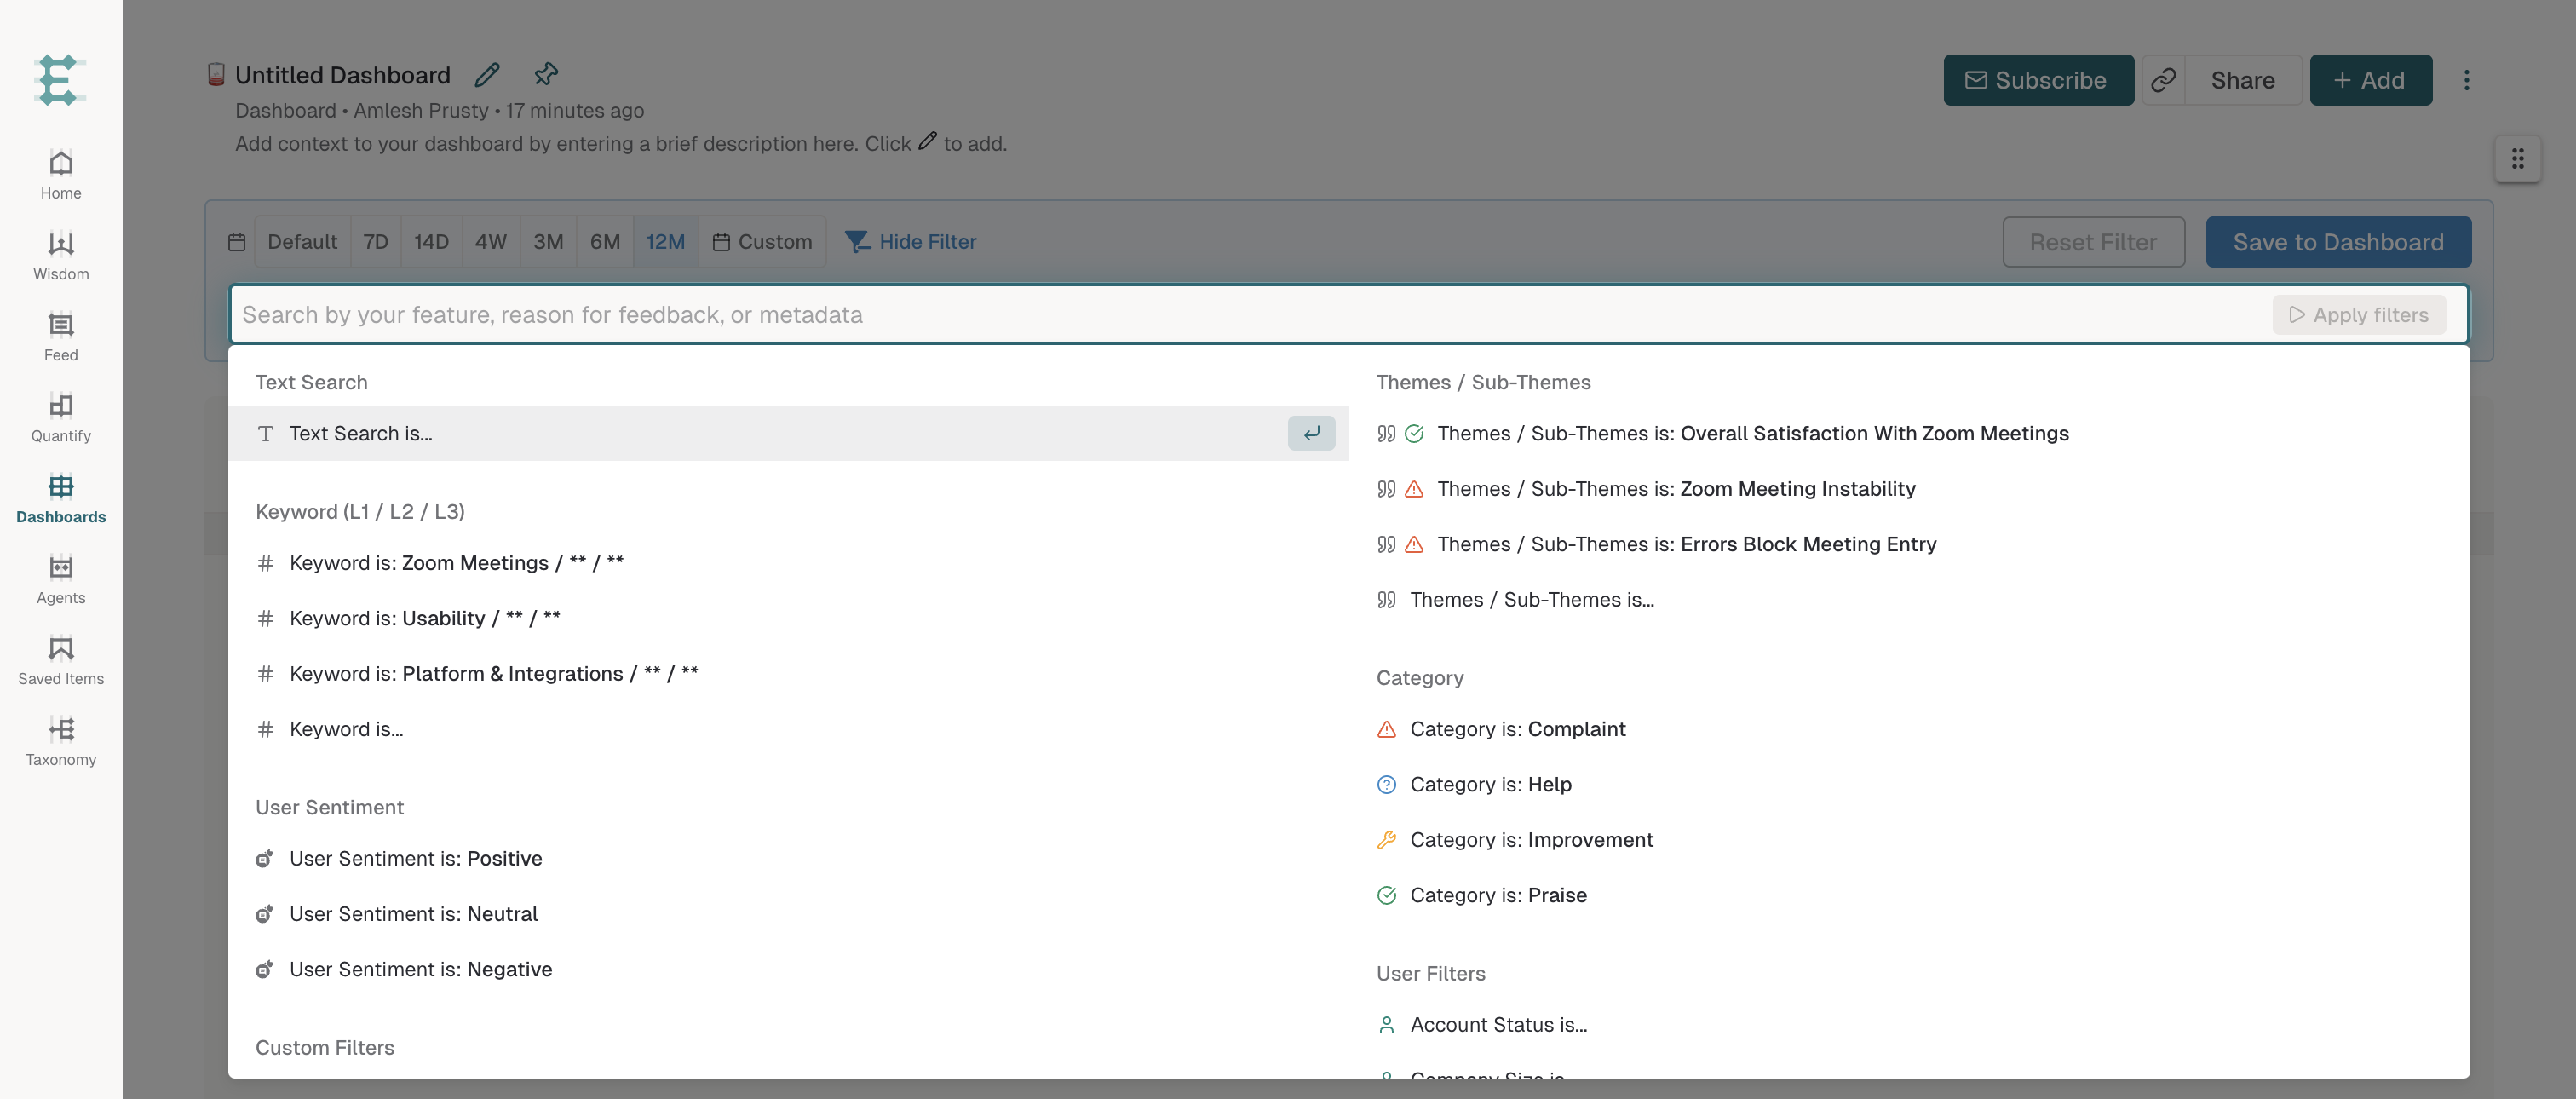
Search for and select the filter you want. You'll see the same filters available when building a Quantify or using Search.
Select and apply the filter(s), then click Apply Filters.

Click Save to Dashboard to make the filter persistent.
How do Dashboard-level filters interact with chart level filters
Dashboard-level filters act like master filters applied over and above existing individual Quantify chart filters.
This is best explained with an example. Let's say you create a Dashboard for Audio Issues with a Dashboard filter: "Source is any of Playstore."
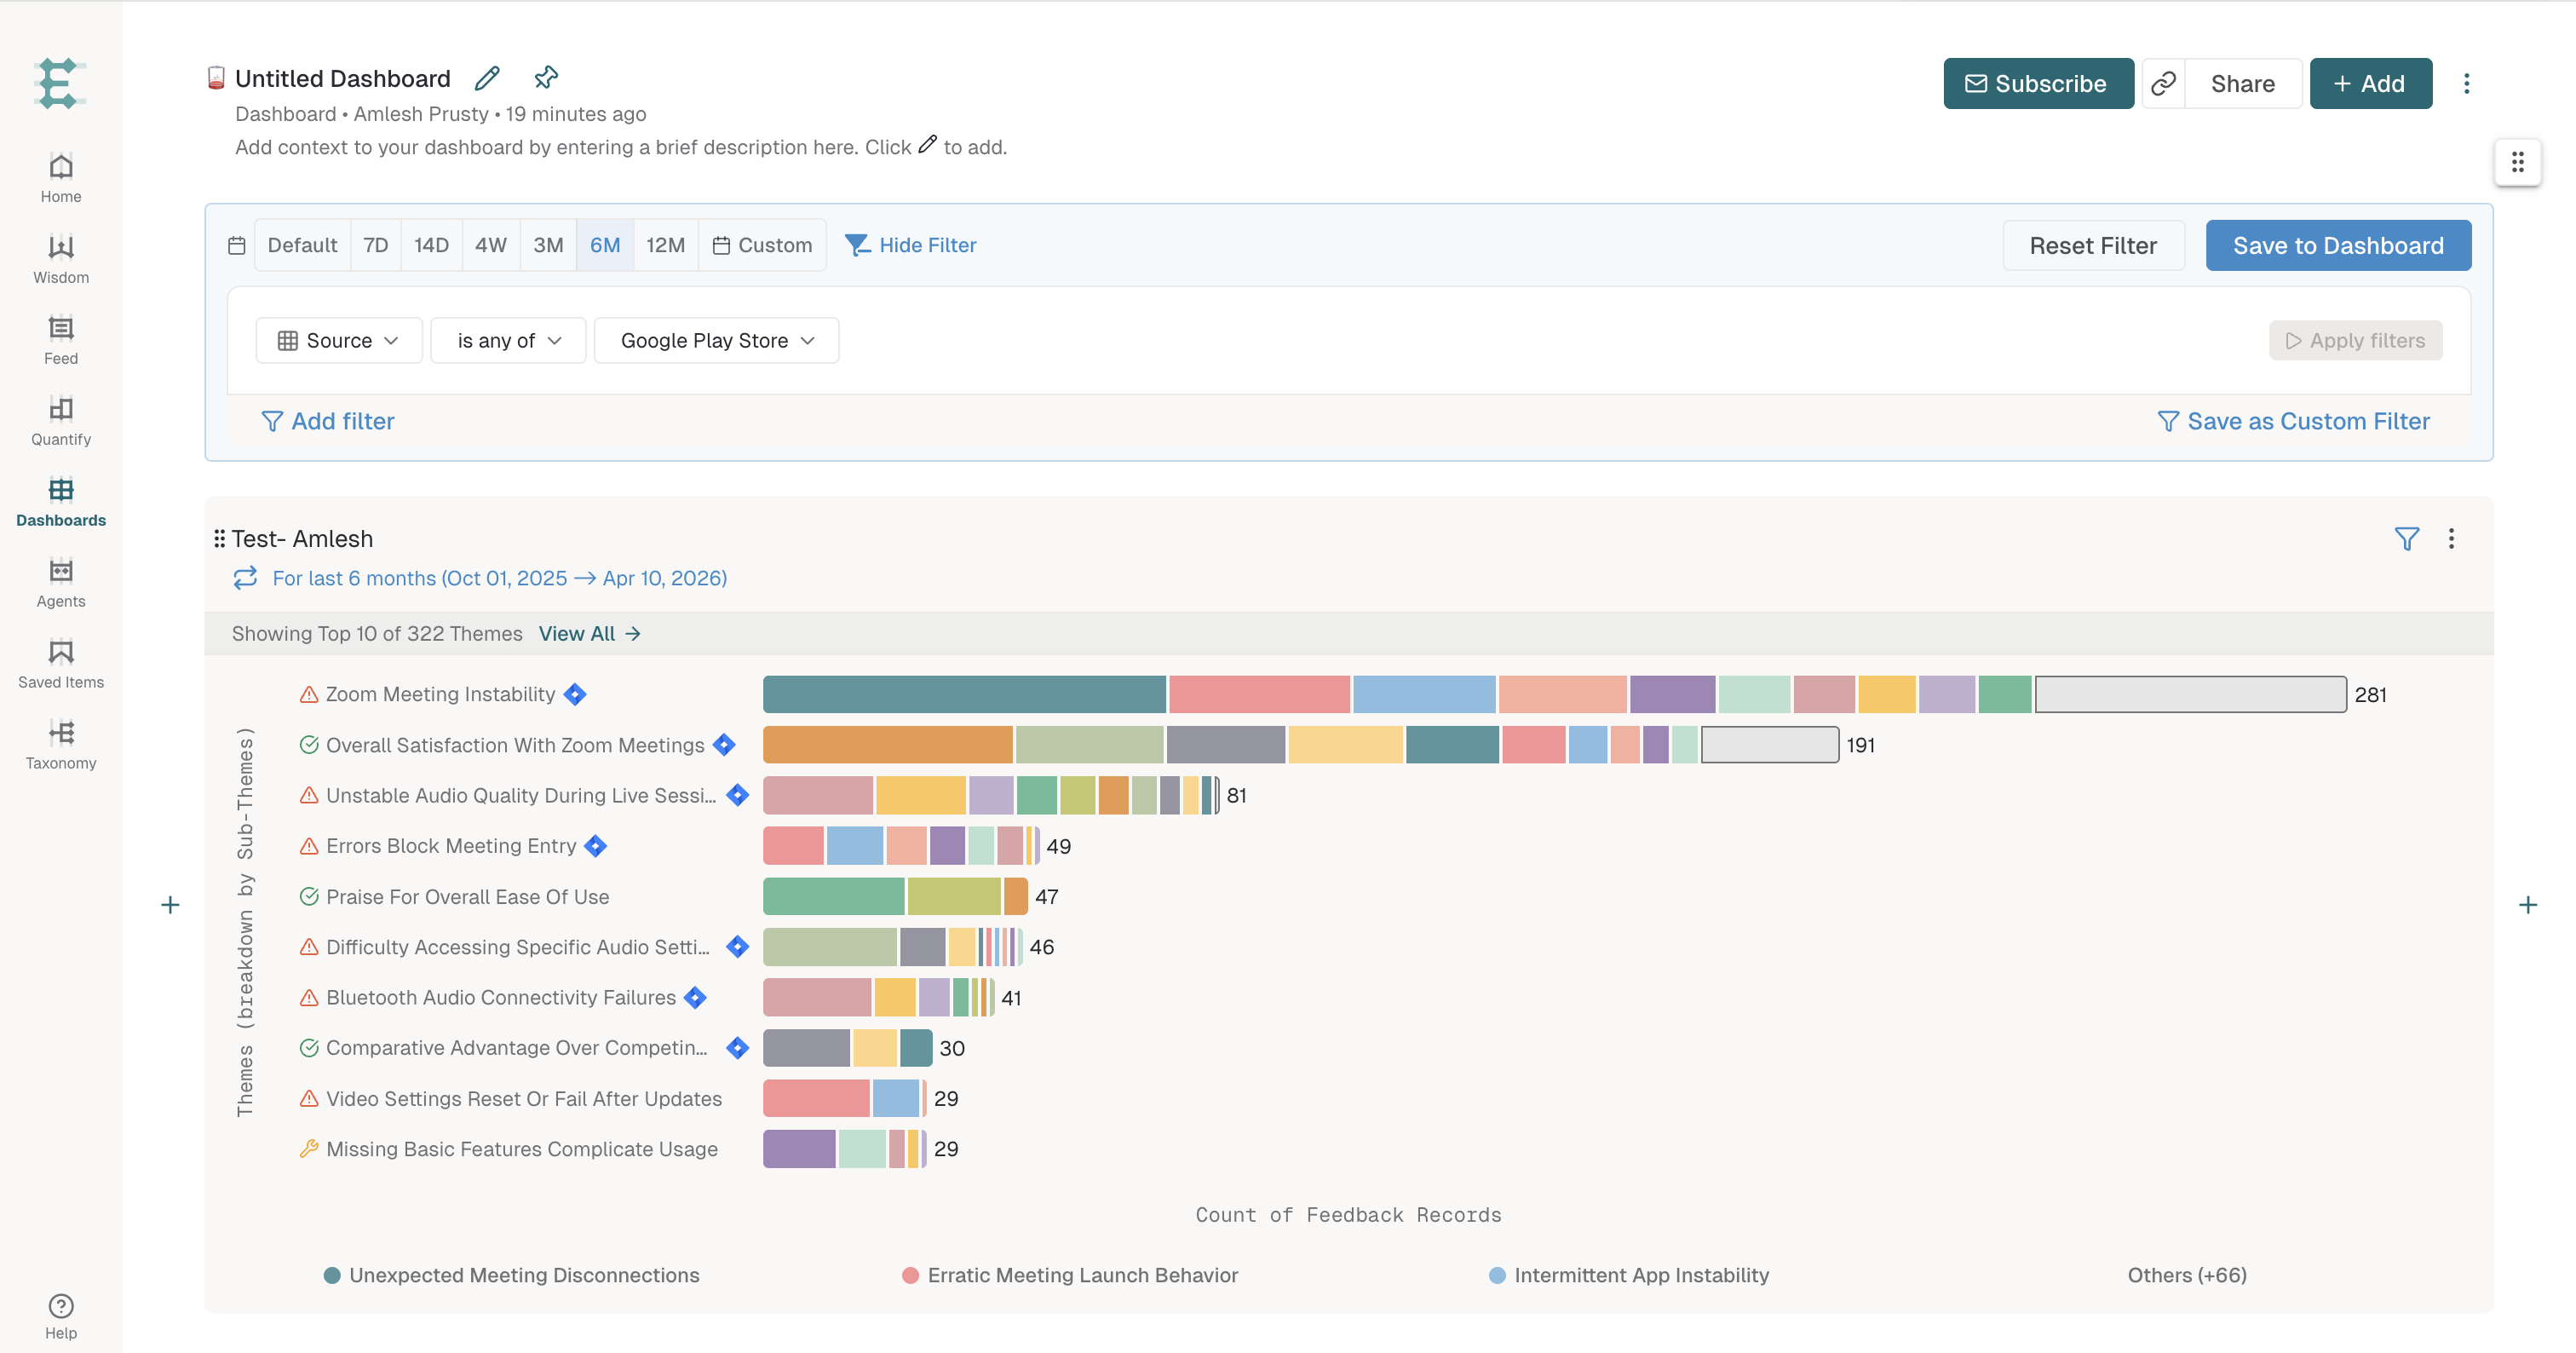
Look at the Quantify chart named "Test-Amlesh" with the Dashboard filter applied.
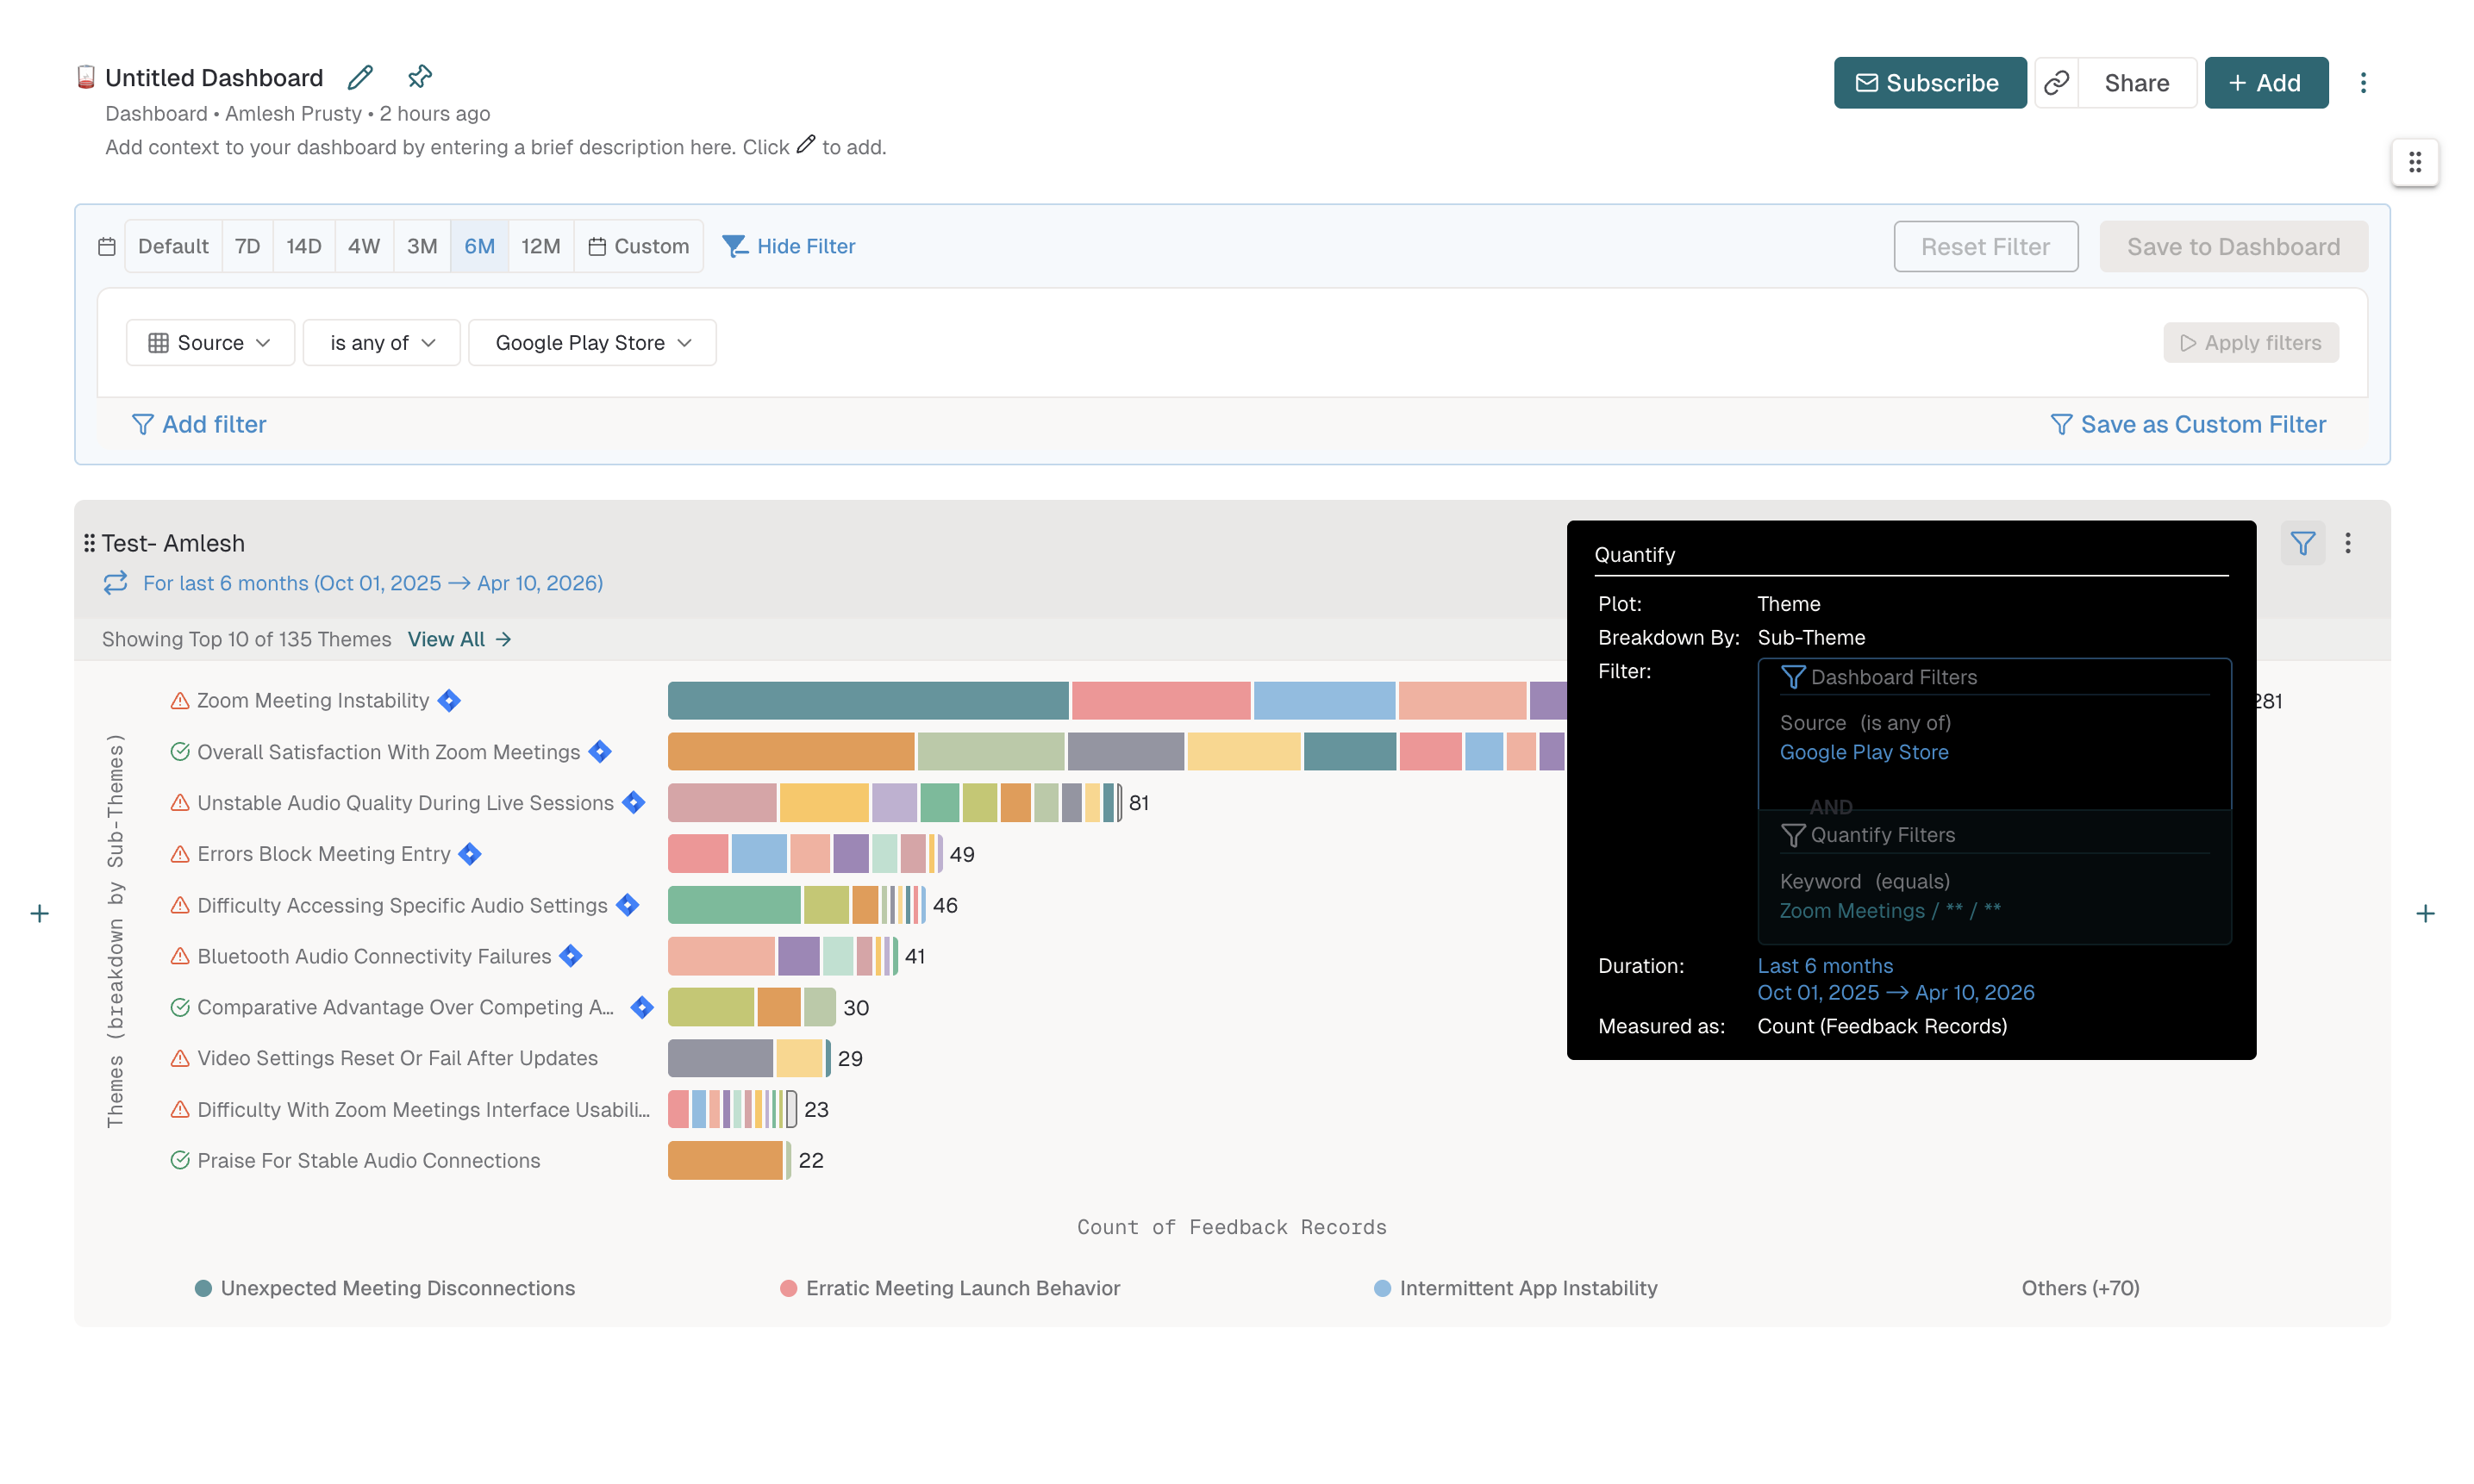
Now remove the Dashboard filter "Source is any of Playstore," keeping only the chart-level filters.
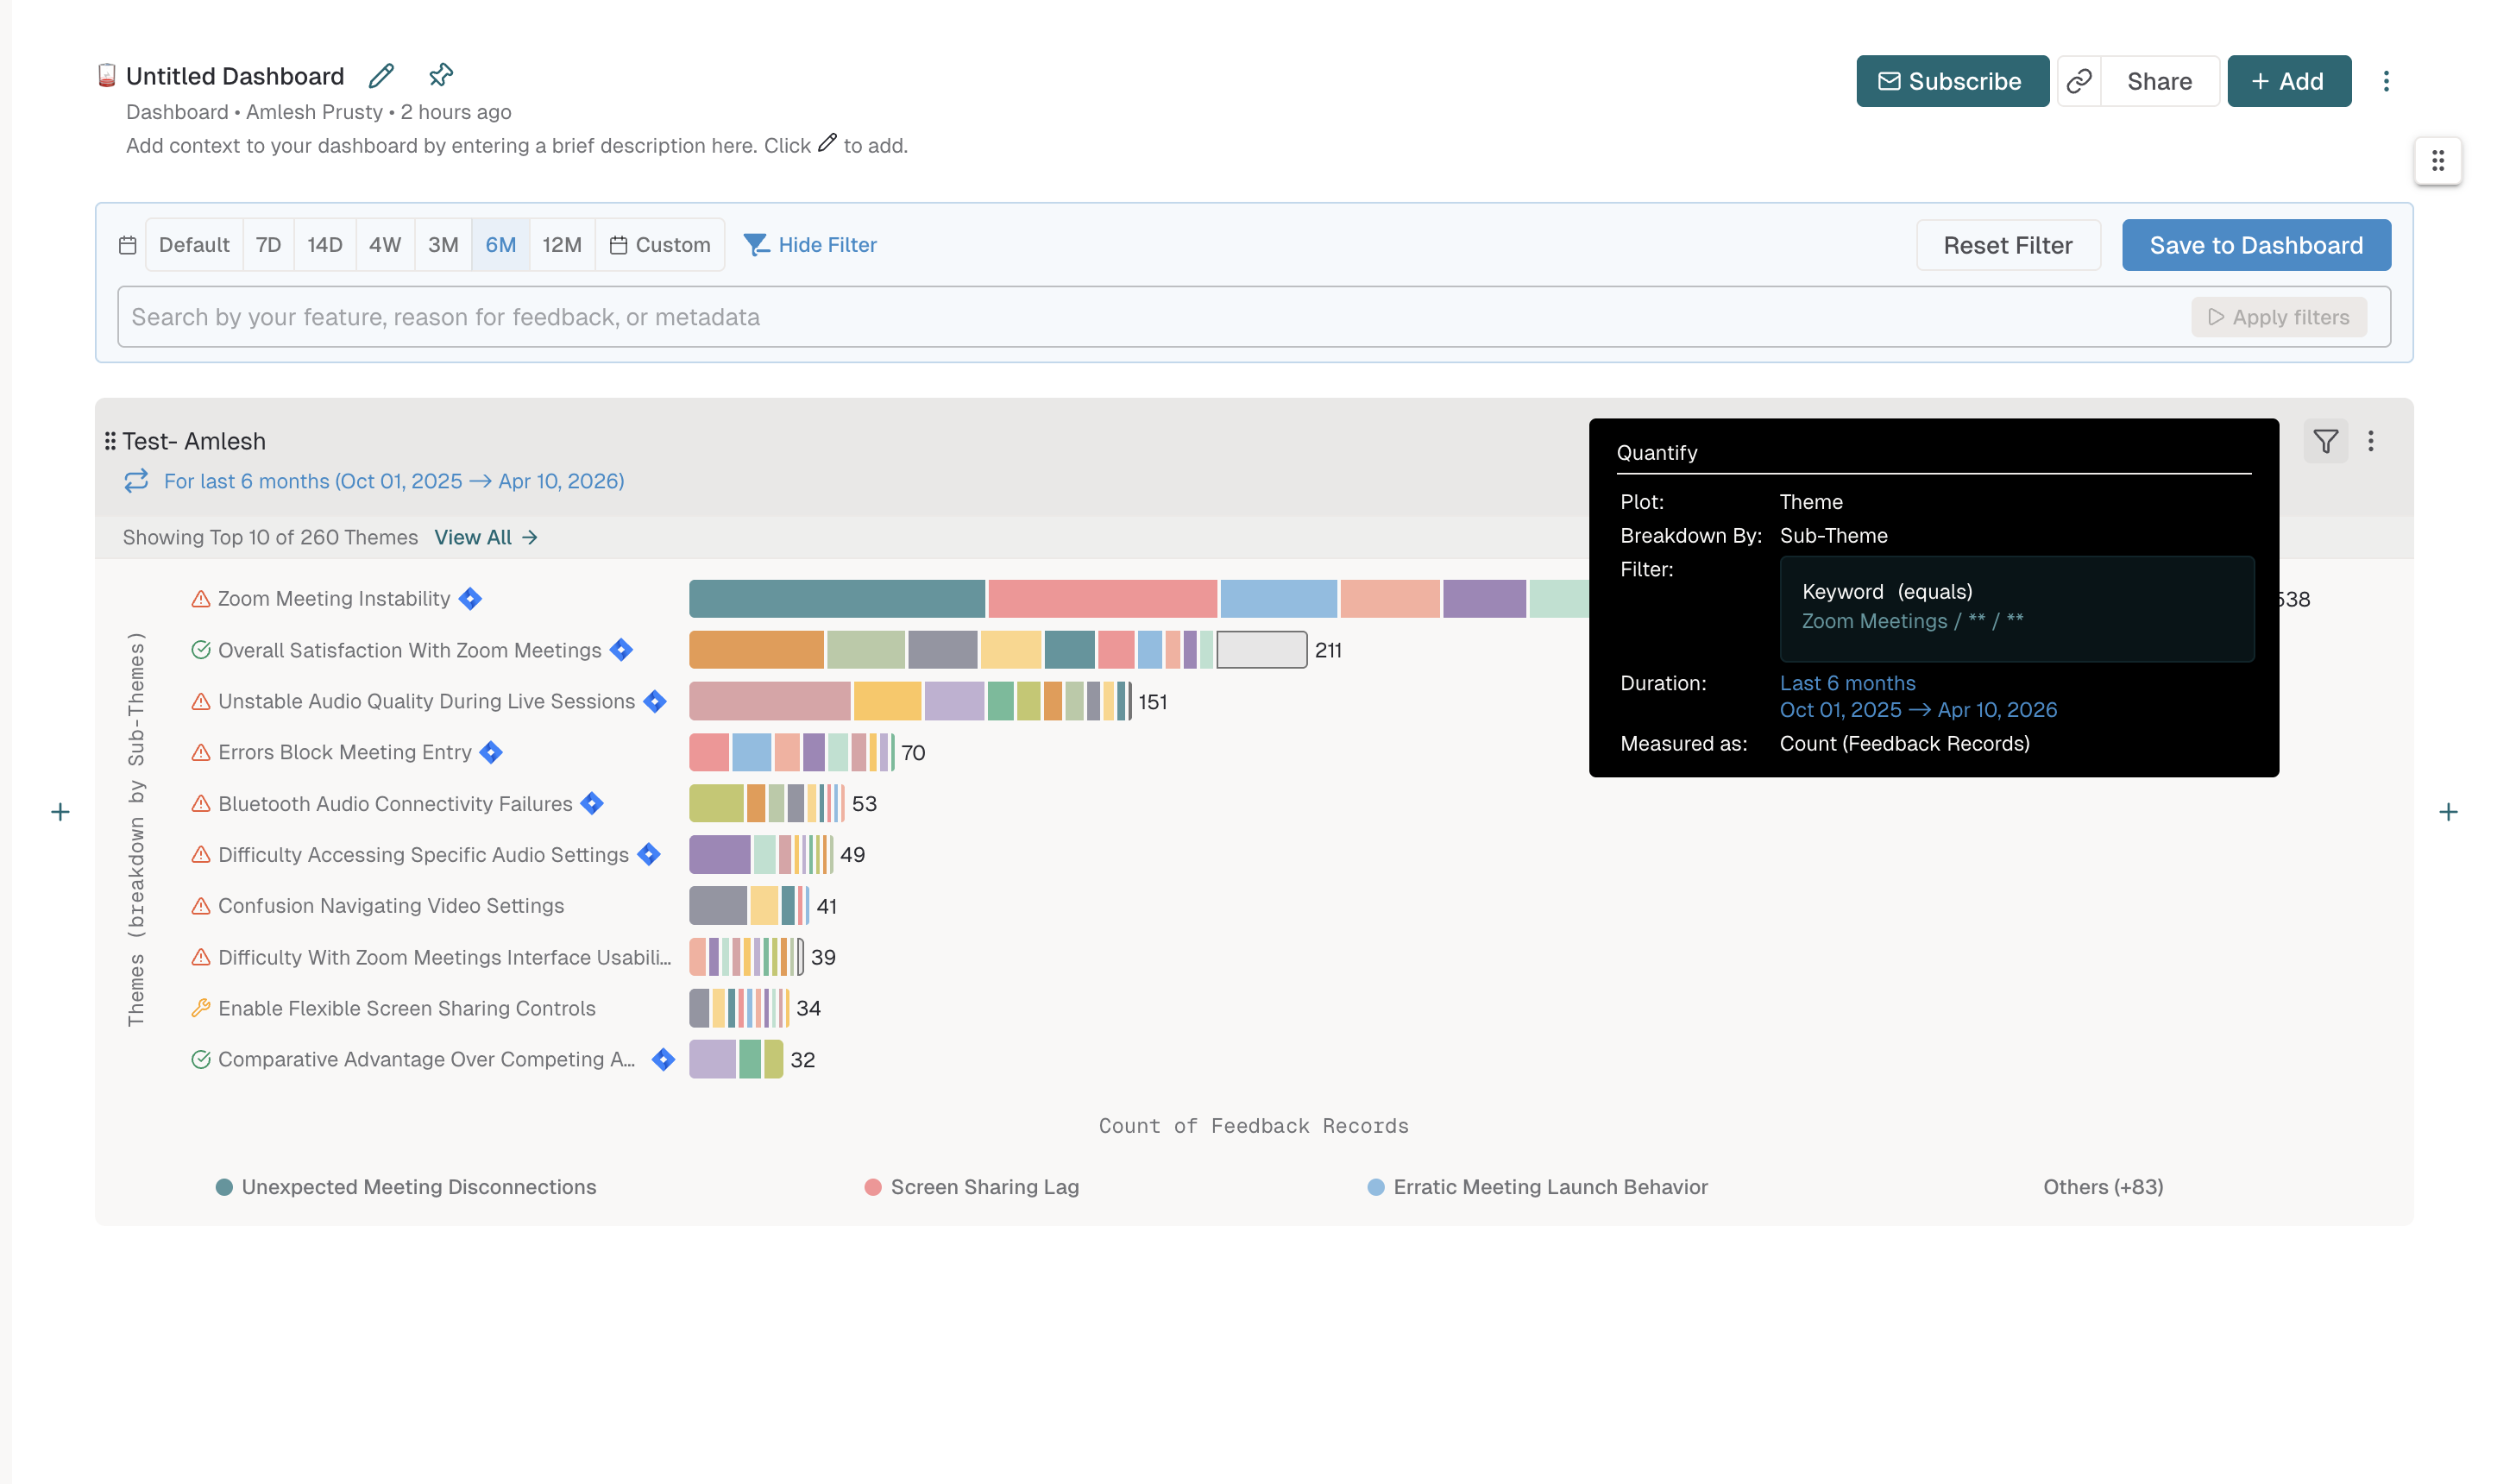
The chart now shows different data because the Dashboard-level filter is no longer constraining the results.
How to remove a Quantify from a Dashboard
On your Dashboard, find the Quantify you want to remove.
Click the three-dot menu in the top-right corner of the chart.
Select Remove from Dashboard from the menu.
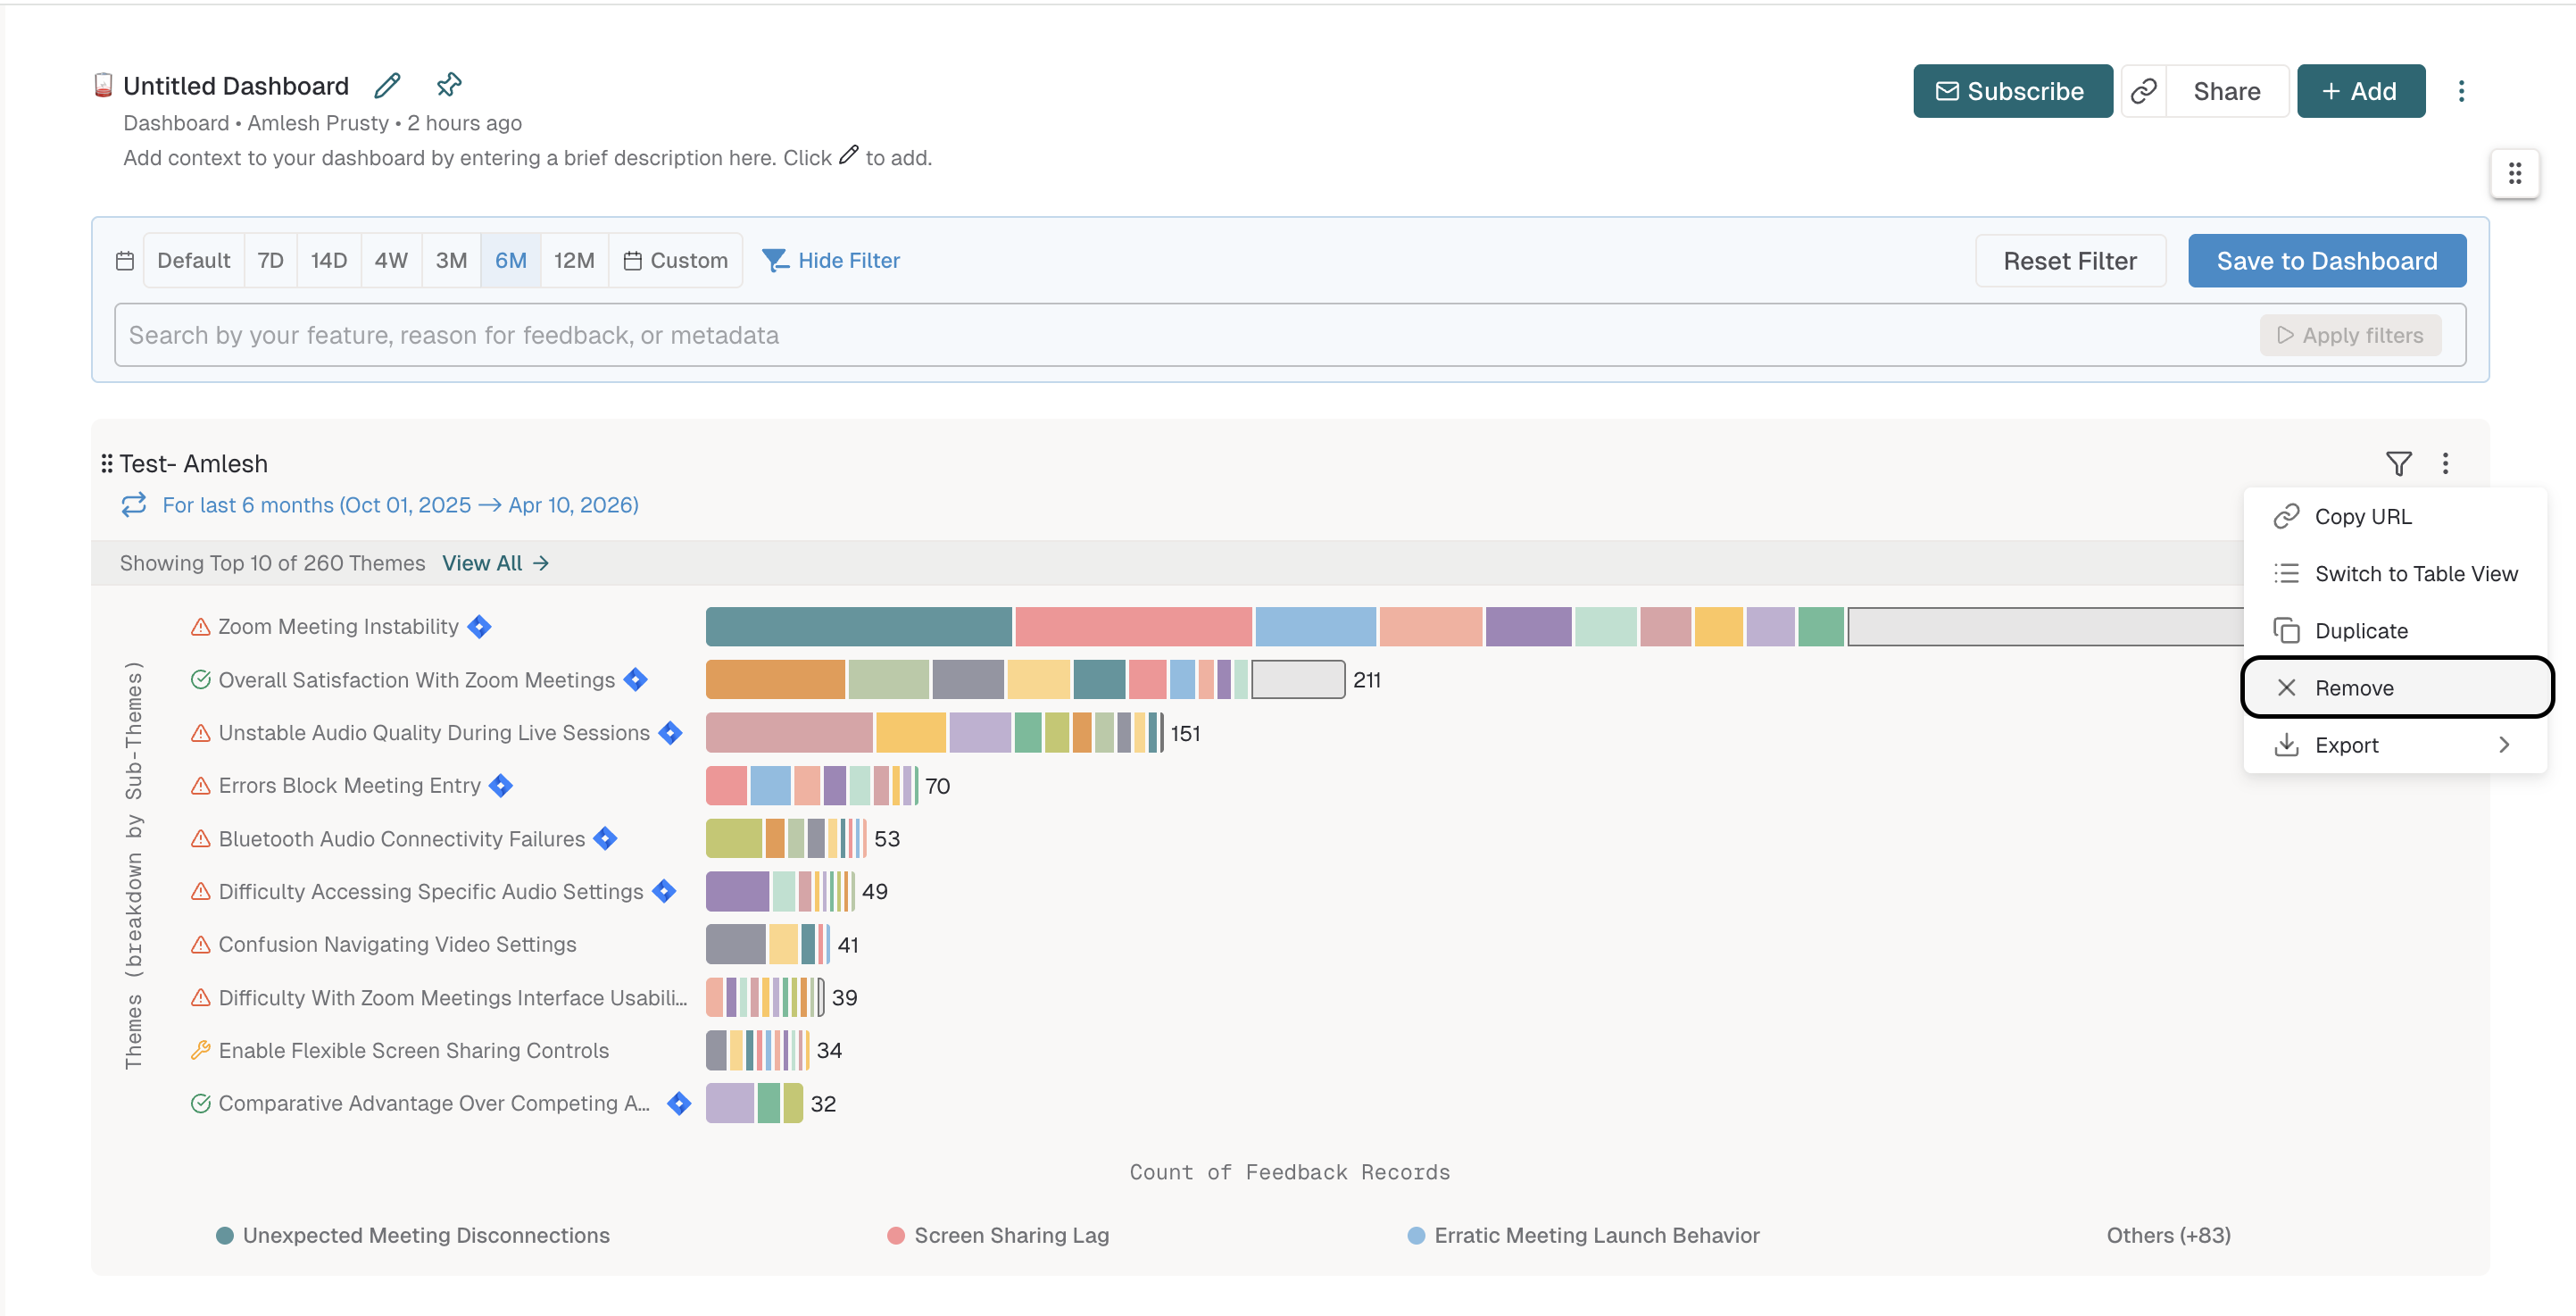
A confirmation message appears in the bottom-left of the screen.
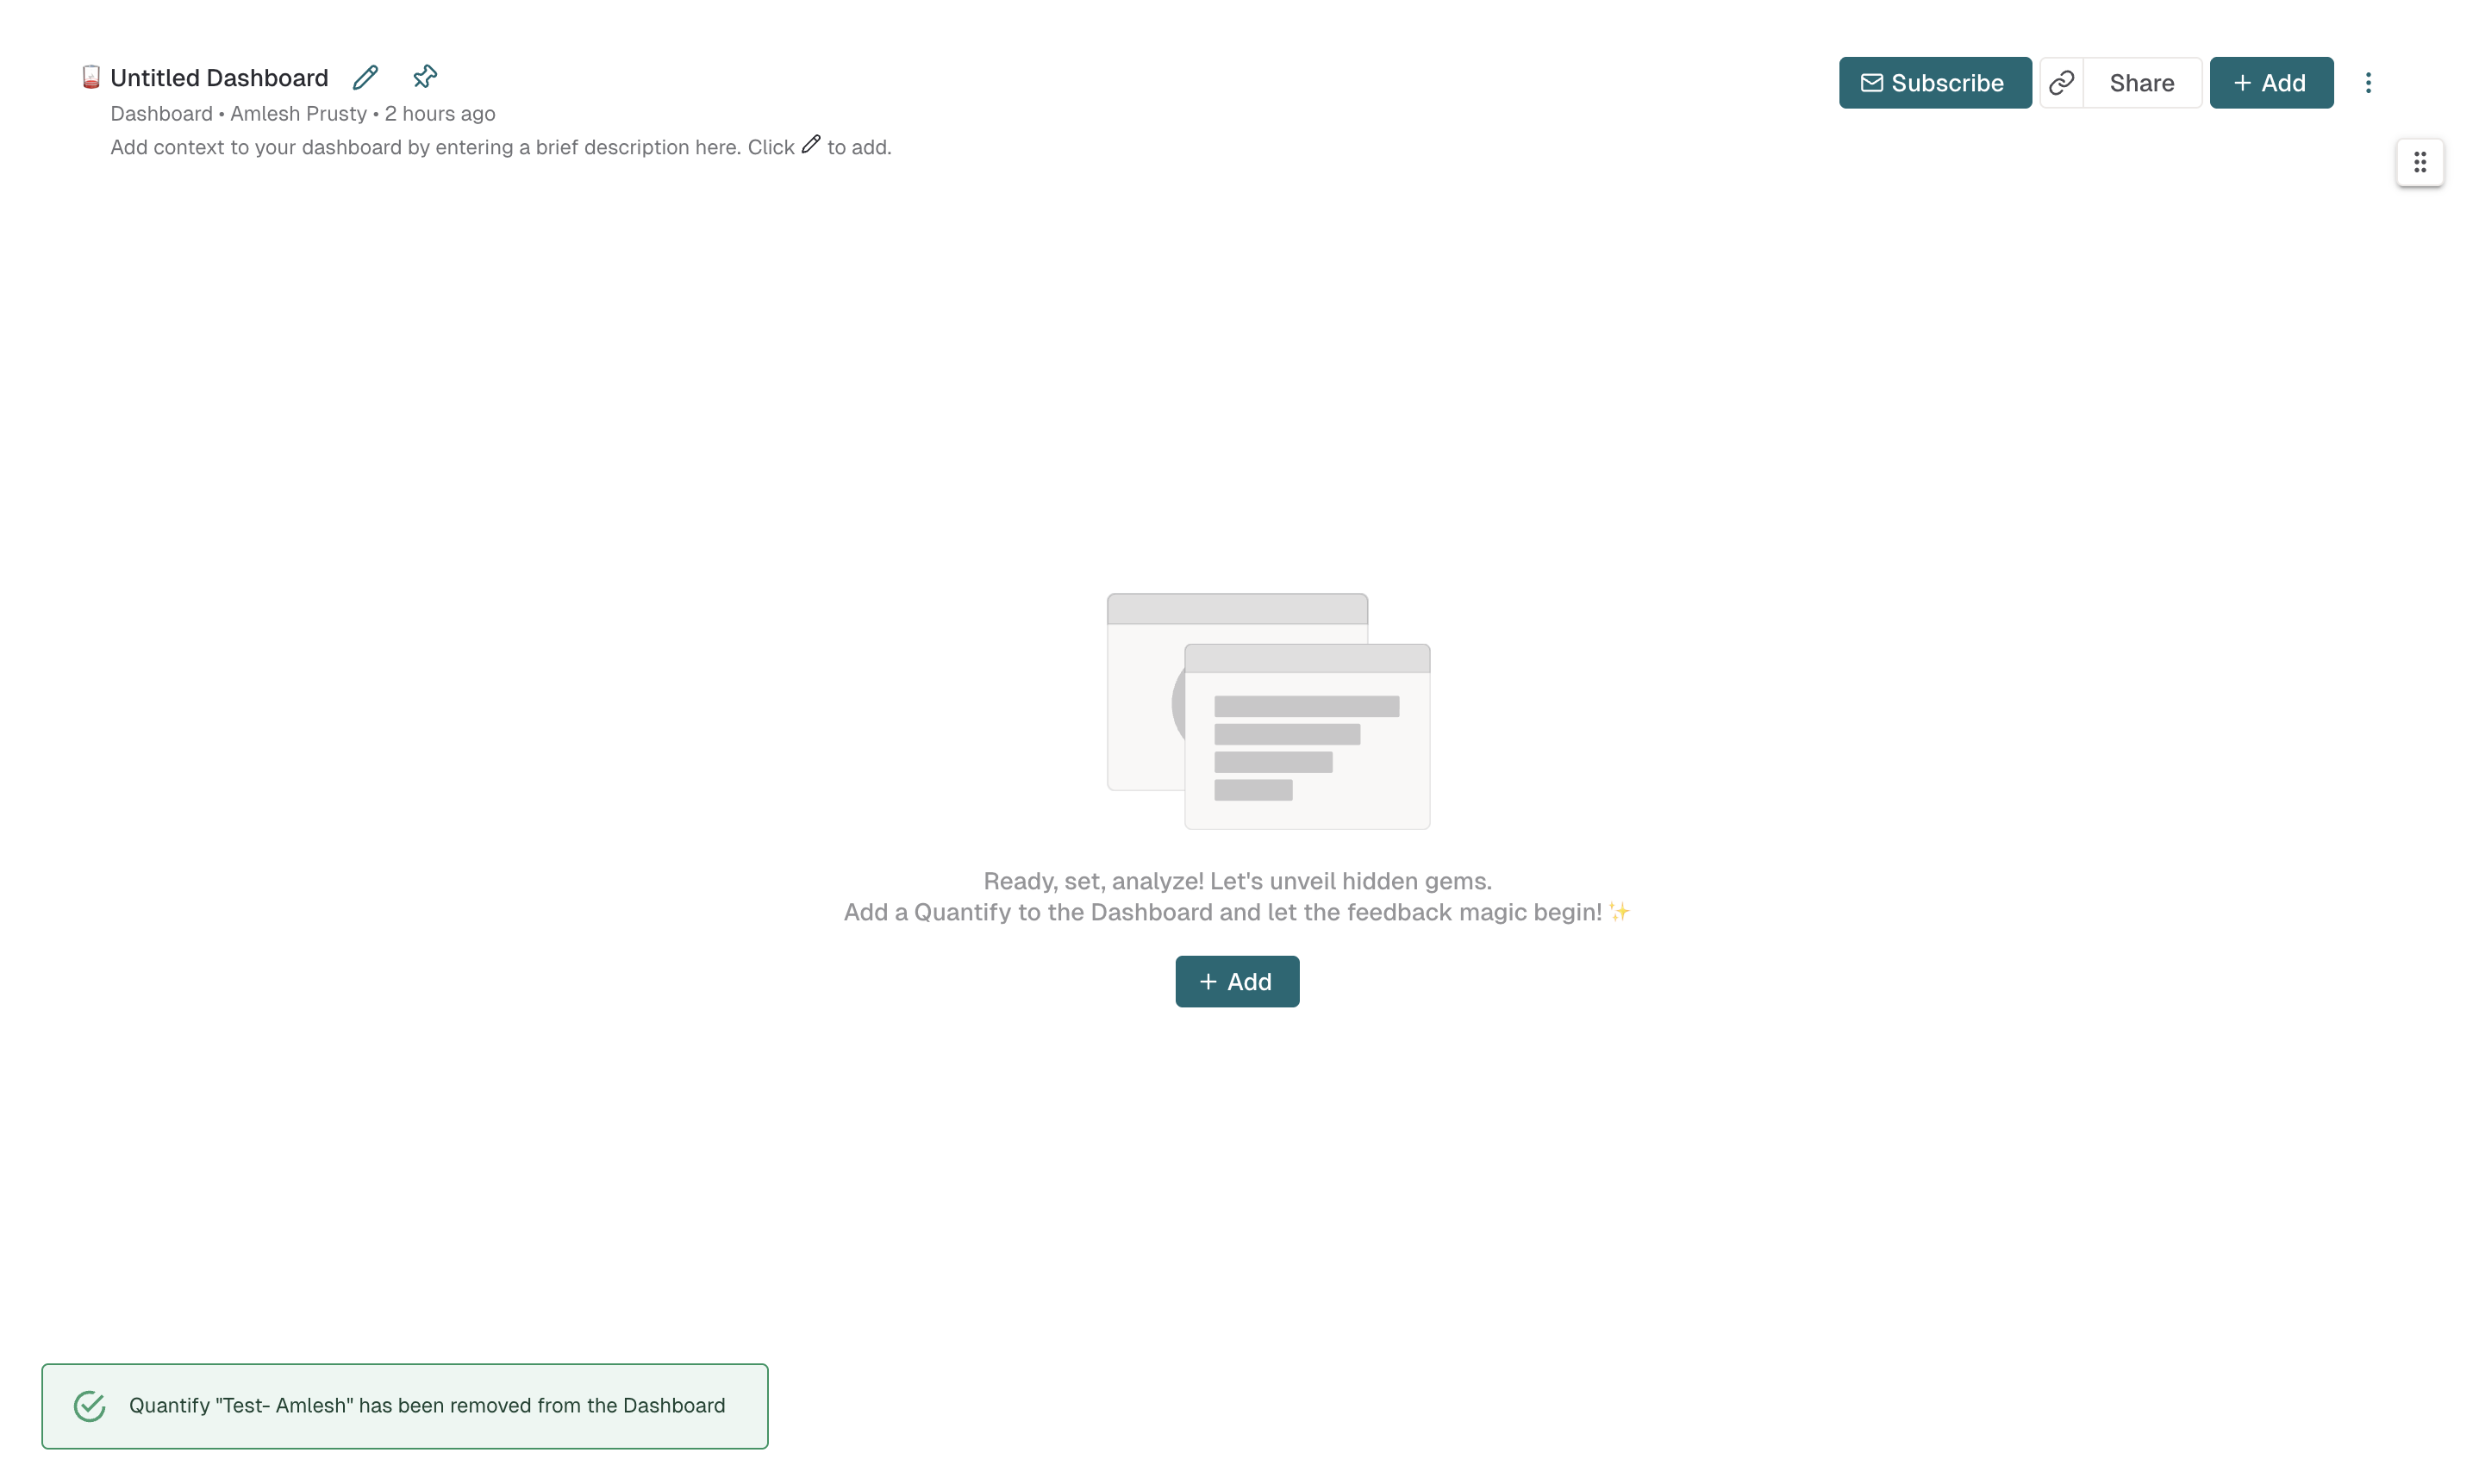
The Quantify is now removed from your Dashboard. The underlying Quantify remains saved and accessible from Saved Items.
Who can edit a Dashboard
Sharing edit access to a Dashboard with your team is an efficient way to collaborate. With Enterpret, sharing your Dashboard is quick and easy.
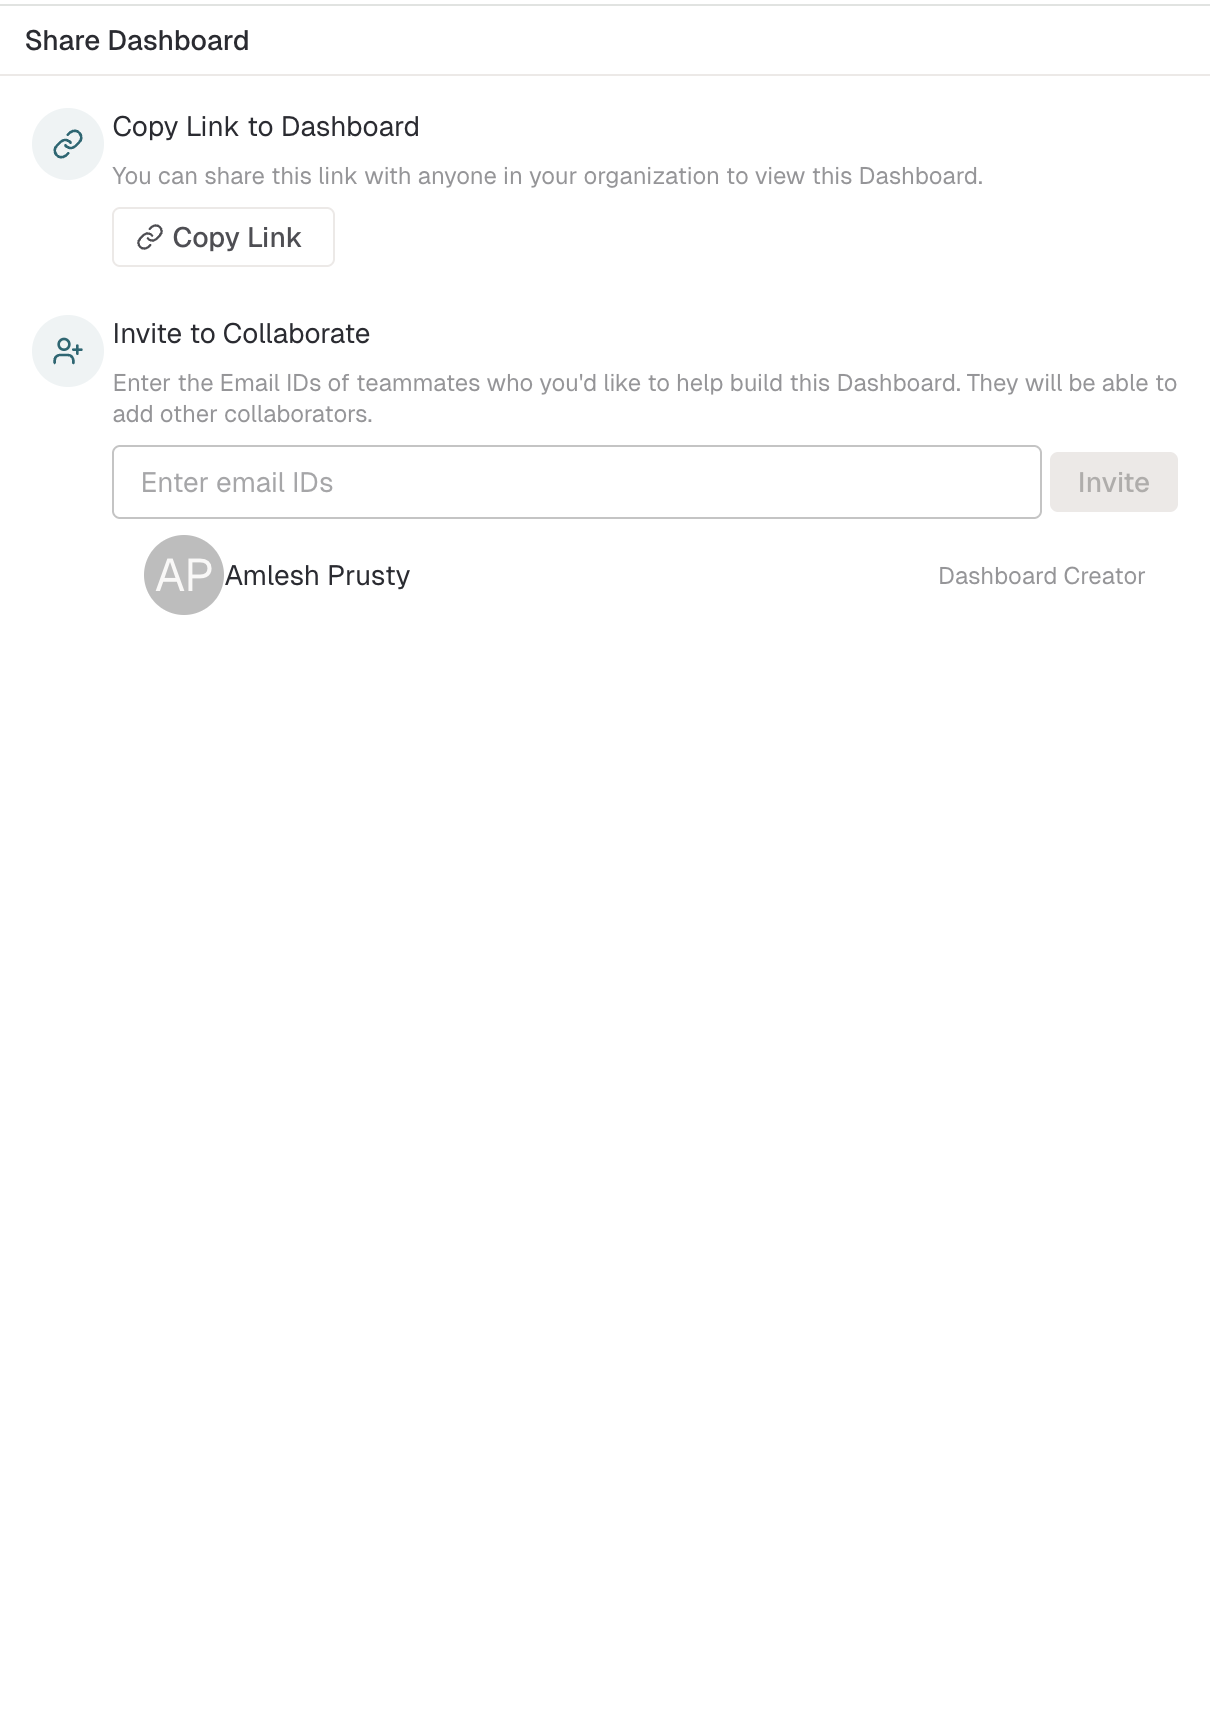
You can invite teammates to edit the Dashboard through the Invite to Collaborate section when you click Share on the Dashboard screen.
You can also provide access to teammates who request it. See Dashboard Sharing & Reporting for the full walkthrough.
Performance improvements
In November 2025, Enterpret reported performance optimizations for large Dashboards. This historical release result is not a fixed load-time guarantee for every Dashboard. If a Dashboard is slow, note the affected widgets and contact your Enterpret team.