
Dashboard Basics
Dashboards in Enterpret are organized collections of Quantify charts. Add existing Quantify charts or create new ones from a Dashboard, and invite your team to edit it together.
Customize Dashboards, schedule reports, and use Dashboard navigation to track feedback and visualize metrics.
How to create a Dashboard
Enterpret helps you create your own personalized Dashboard for various kinds of analyses you might want to perform. To create a new Dashboard, follow these steps.
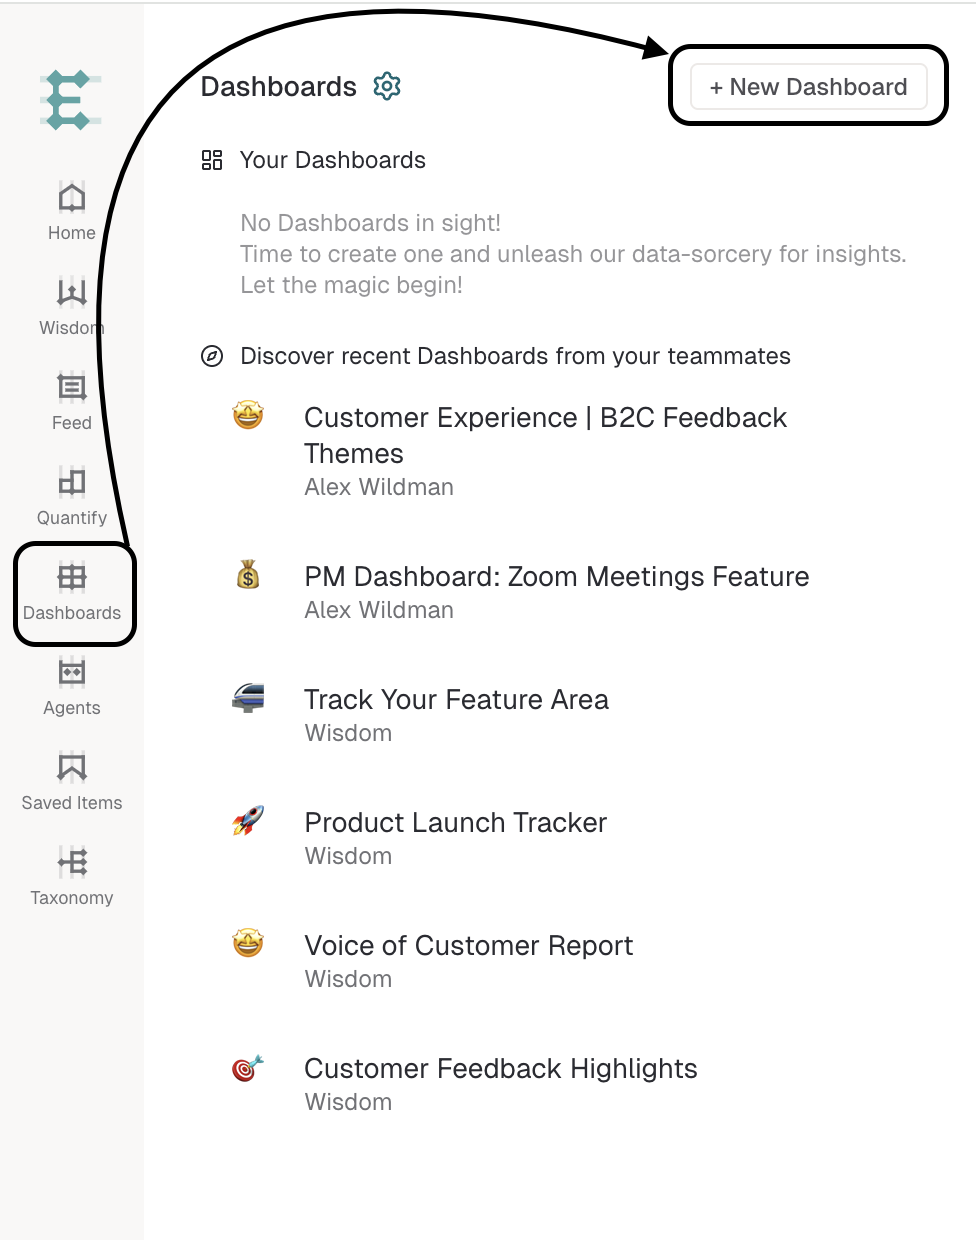
Where Dashboards is available, open More → Dashboards in the sidebar. Some navigation layouts show Dashboards directly. If the destination is absent, use the analysis surfaces available in your workspace or contact your Enterpret team.
Click the New Dashboard button to get started.
Click + New Blank Dashboard (to build from scratch) or use one of the pre-built templates (to start with pre-existing Quantify charts and filters).
For a new, unsaved Dashboard, use the pencil icon beside its name. For a saved Dashboard you can edit, open the toolbar’s more menu and choose Edit Dashboard Details.
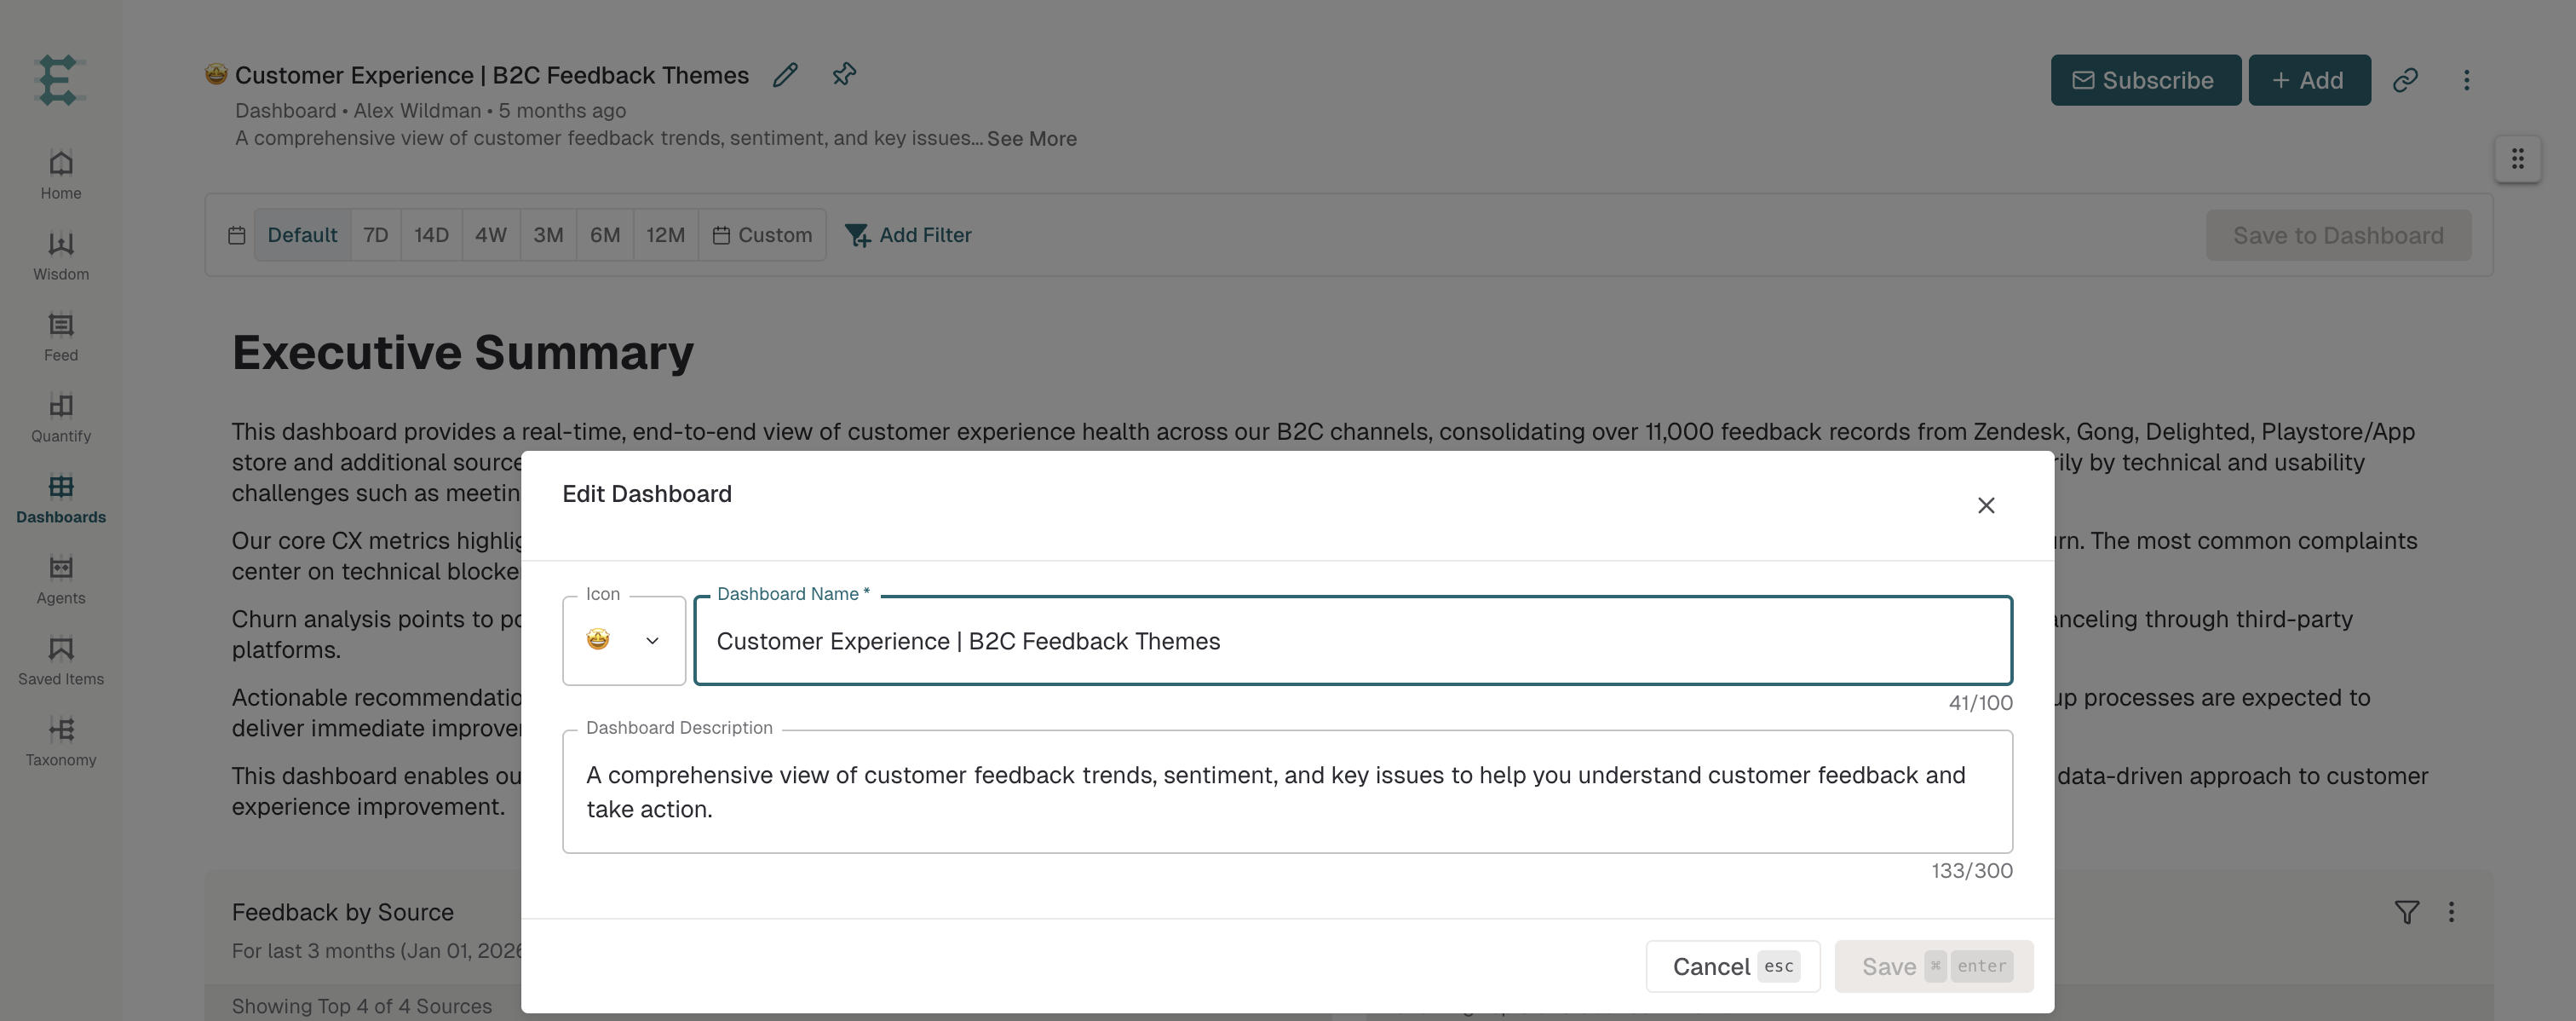
Enter the name and description, then click Save.
Adding Quantify to your Dashboard
Quantify lets you count and compare customer feedback. Use the relevant filters and counting method for your question, and review representative records before drawing conclusions. Learn more
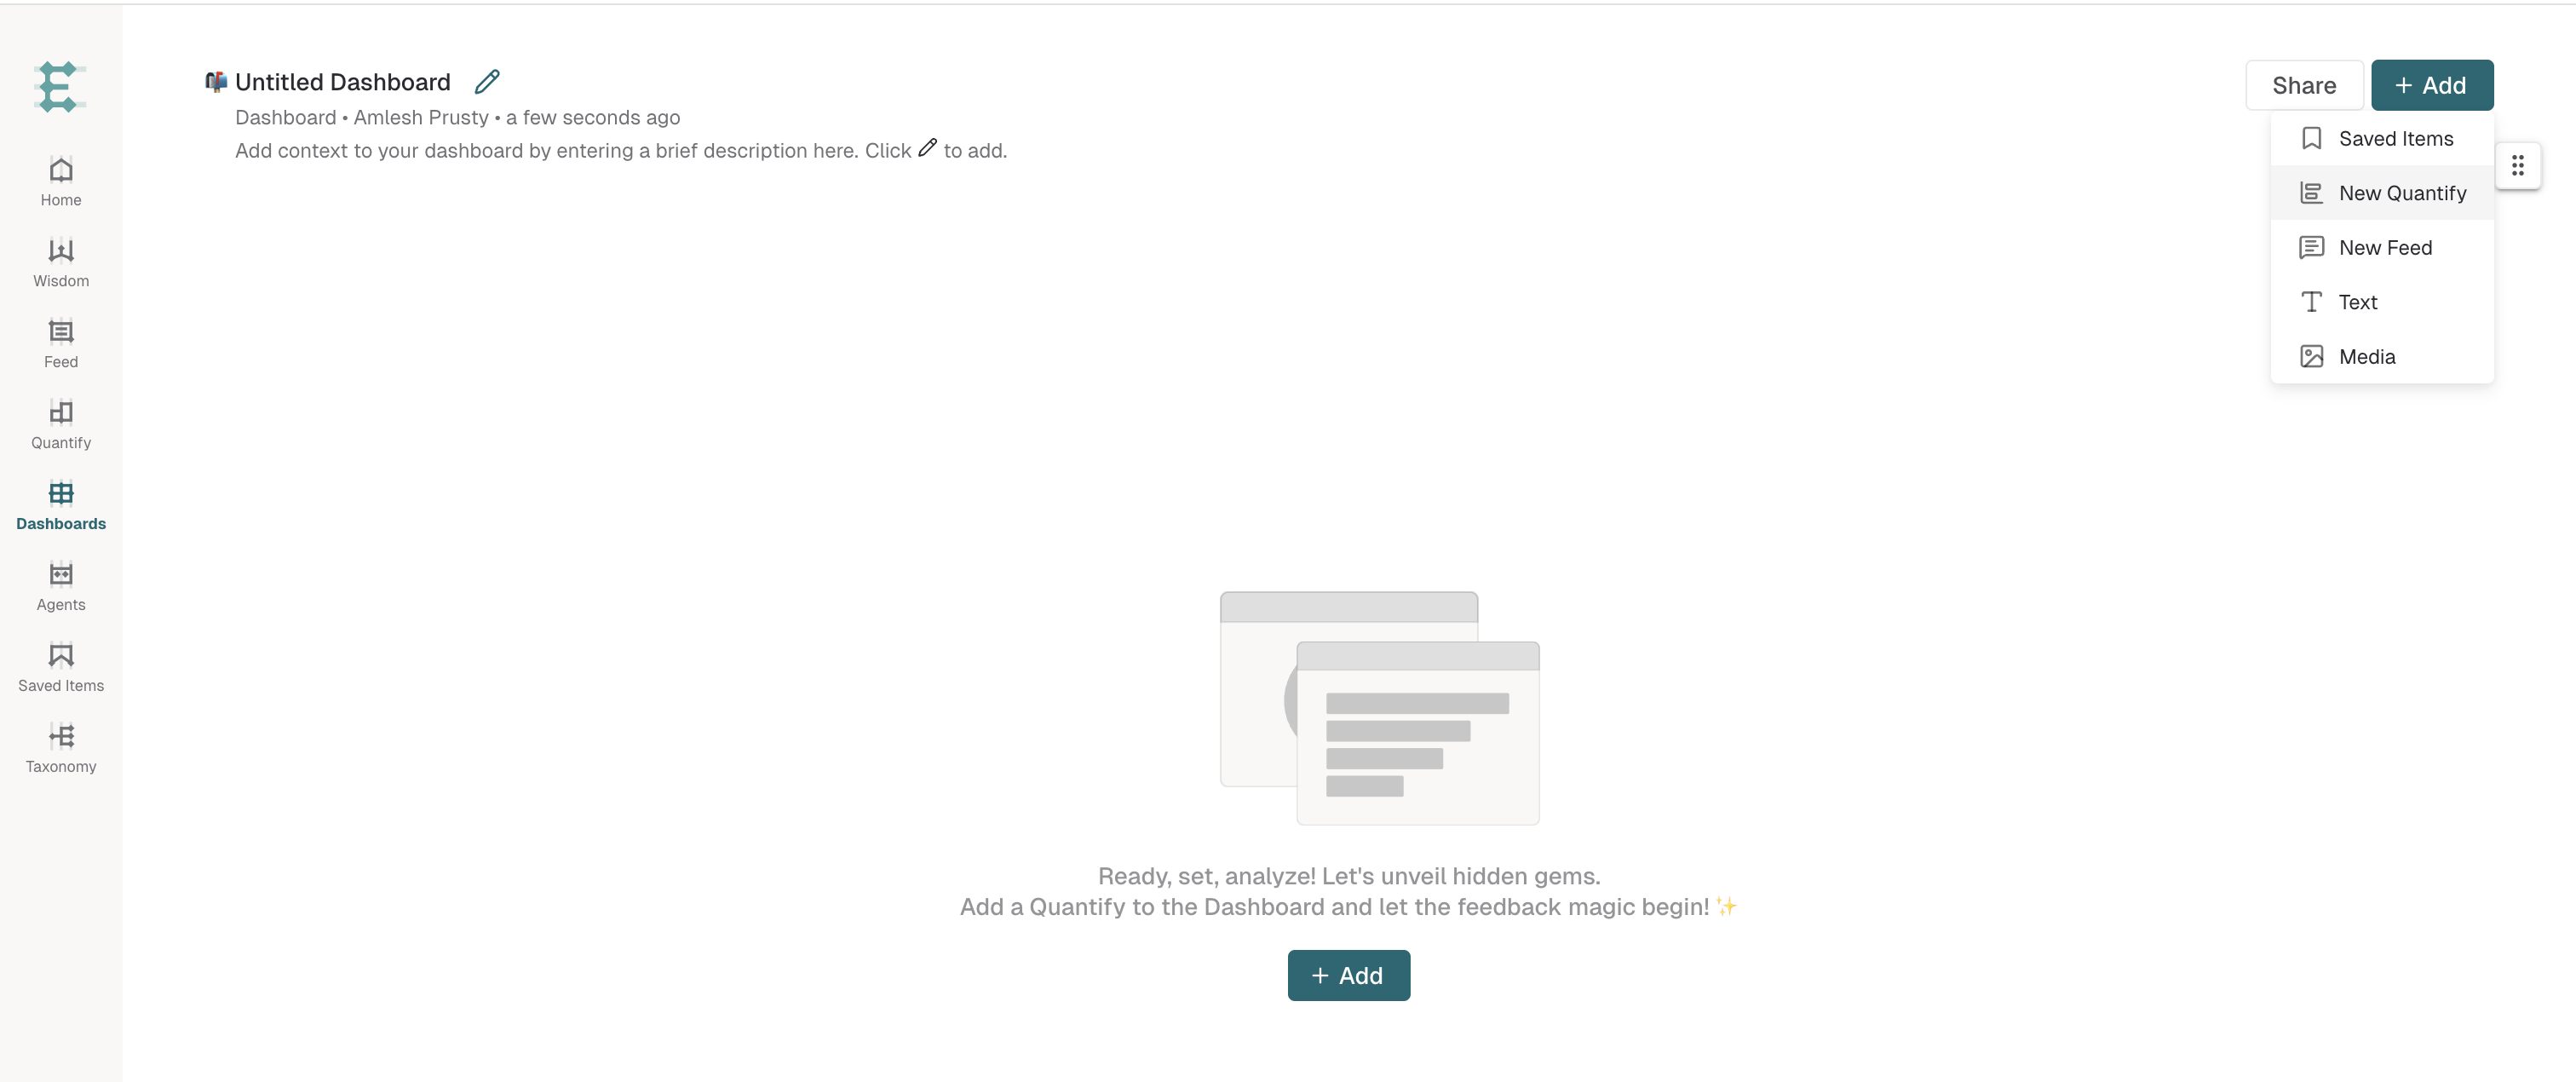
In case of a new Blank Dashboard:
Click the Add button to add an existing or new Quantify to your Dashboard.
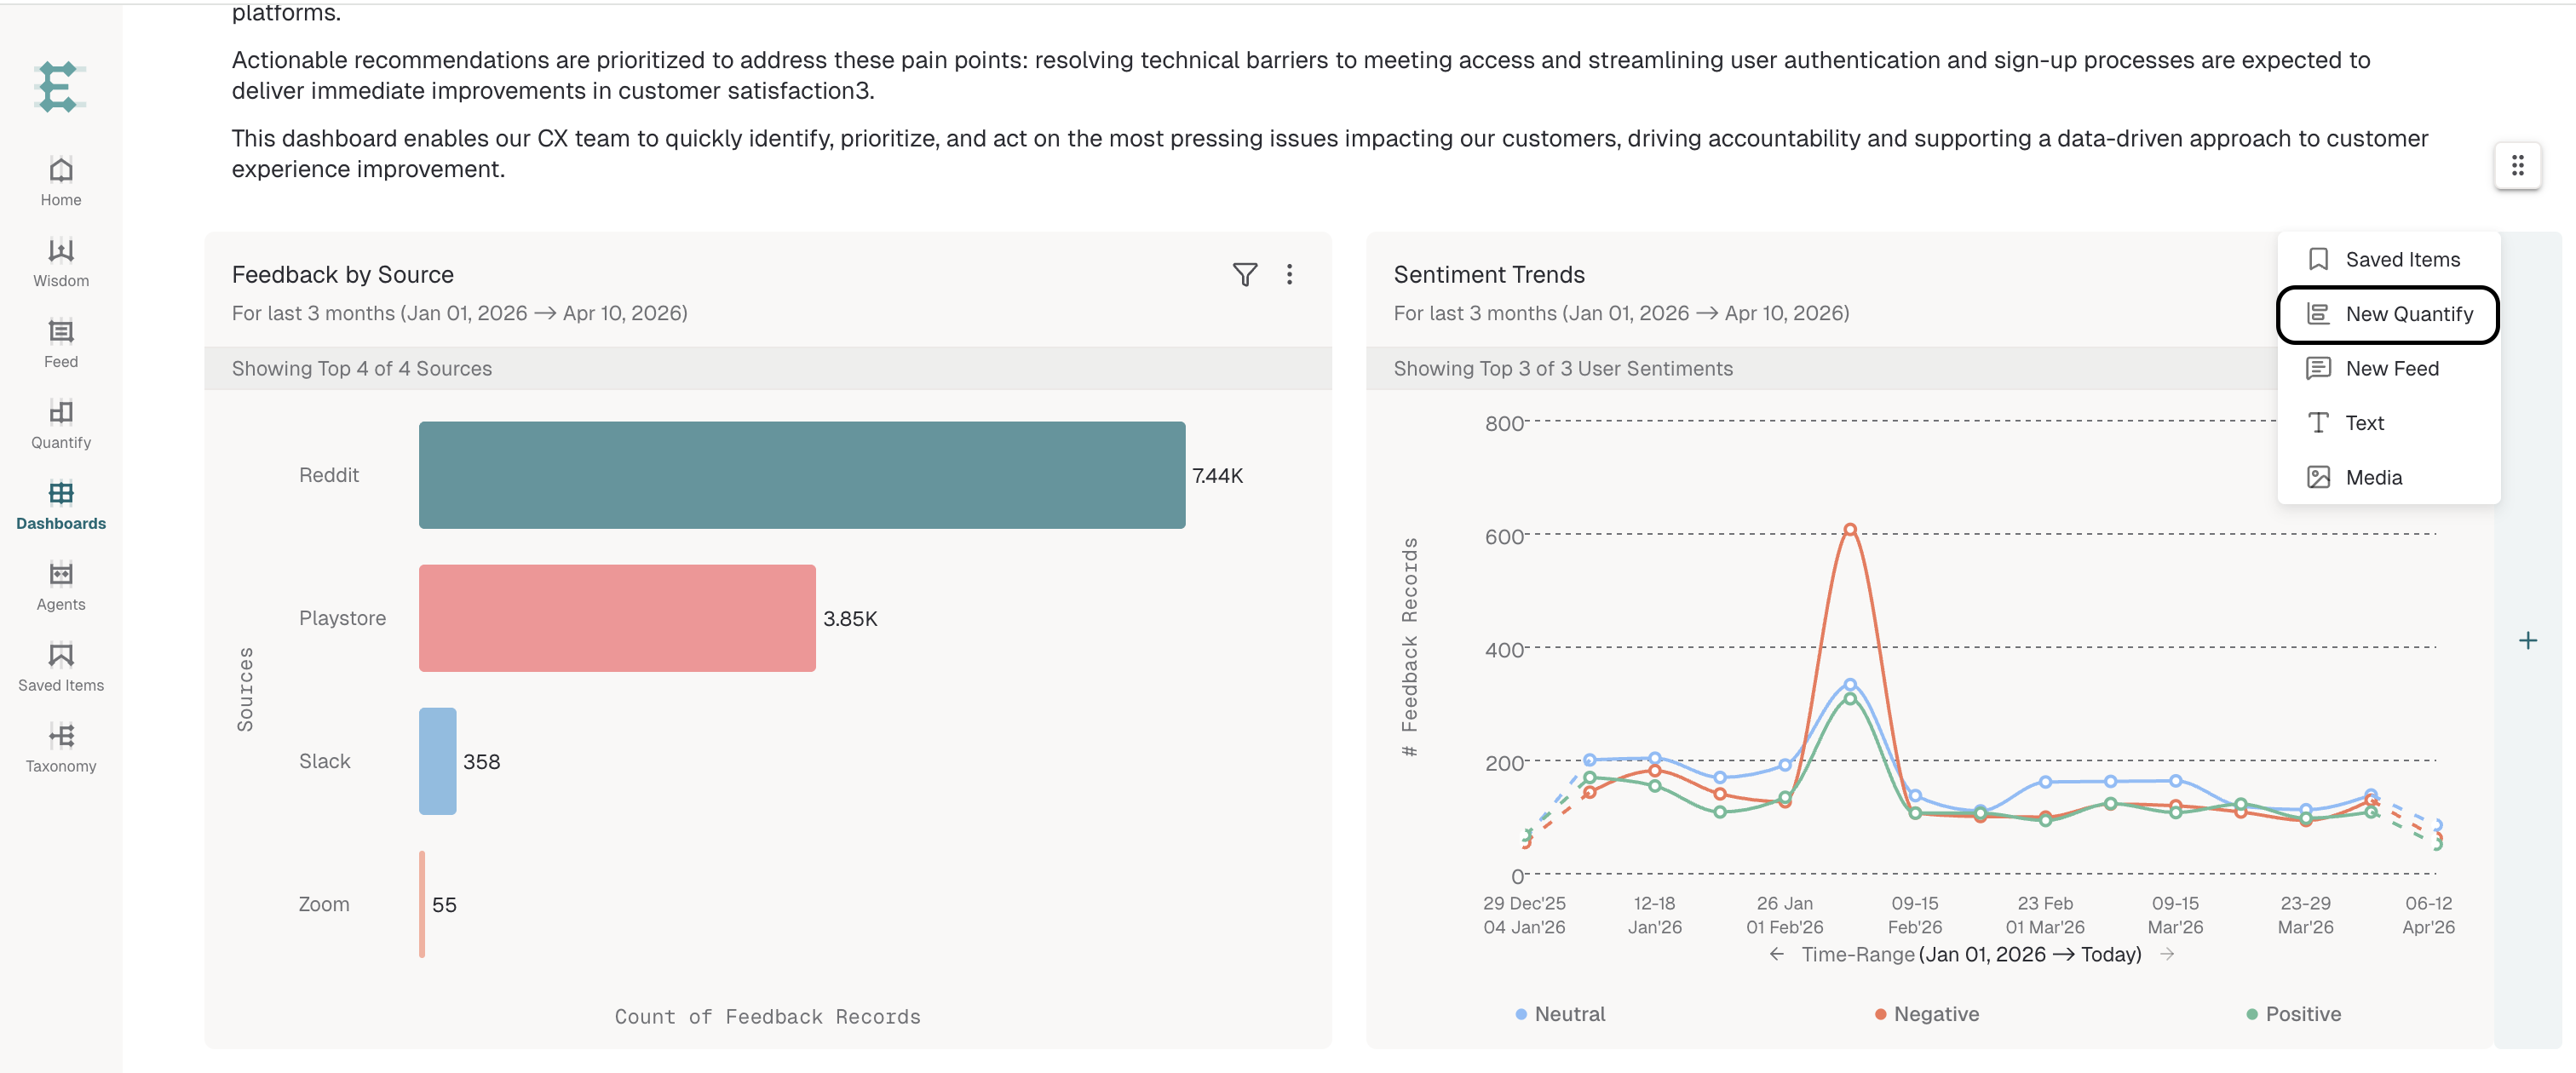
In case of a Dashboard with existing Quantify Charts:
Click the + icons on the sides of charts to add a new Quantify, or click + Add Content at the bottom to add an existing or new Quantify.
How to find a Dashboard
There are various ways to find a Dashboard, from the navigation bar or from Saved Items.
From the Navigation bar
The Dashboards destination shows your Dashboards and available recent team Dashboards. Sections and pinned shortcuts depend on your navigation.
Use your Dashboard list or an available pinned shortcut for quick access.
Look under Your Dashboards for work you created.
Use the recent teammate Dashboards list or Saved Items to find available team work.
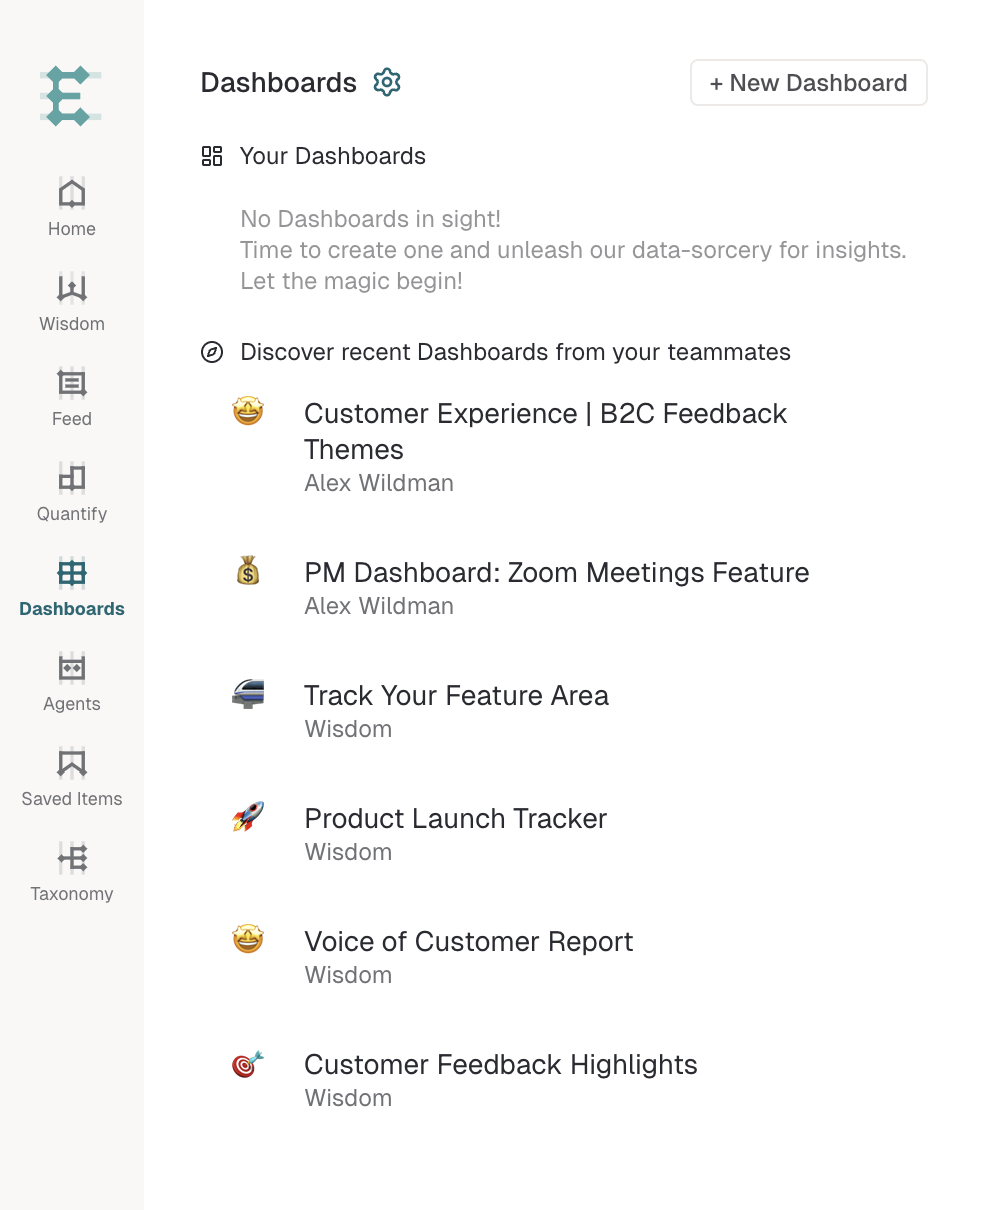
From Saved Items
You can also find your own or your teammates' Dashboards through More → Saved Items where offered, or with ⌘+K / Ctrl+K. Some layouts show Saved Items directly.
Click Saved Items.
Select the Dashboard item-type filter in Browse Saved Items.
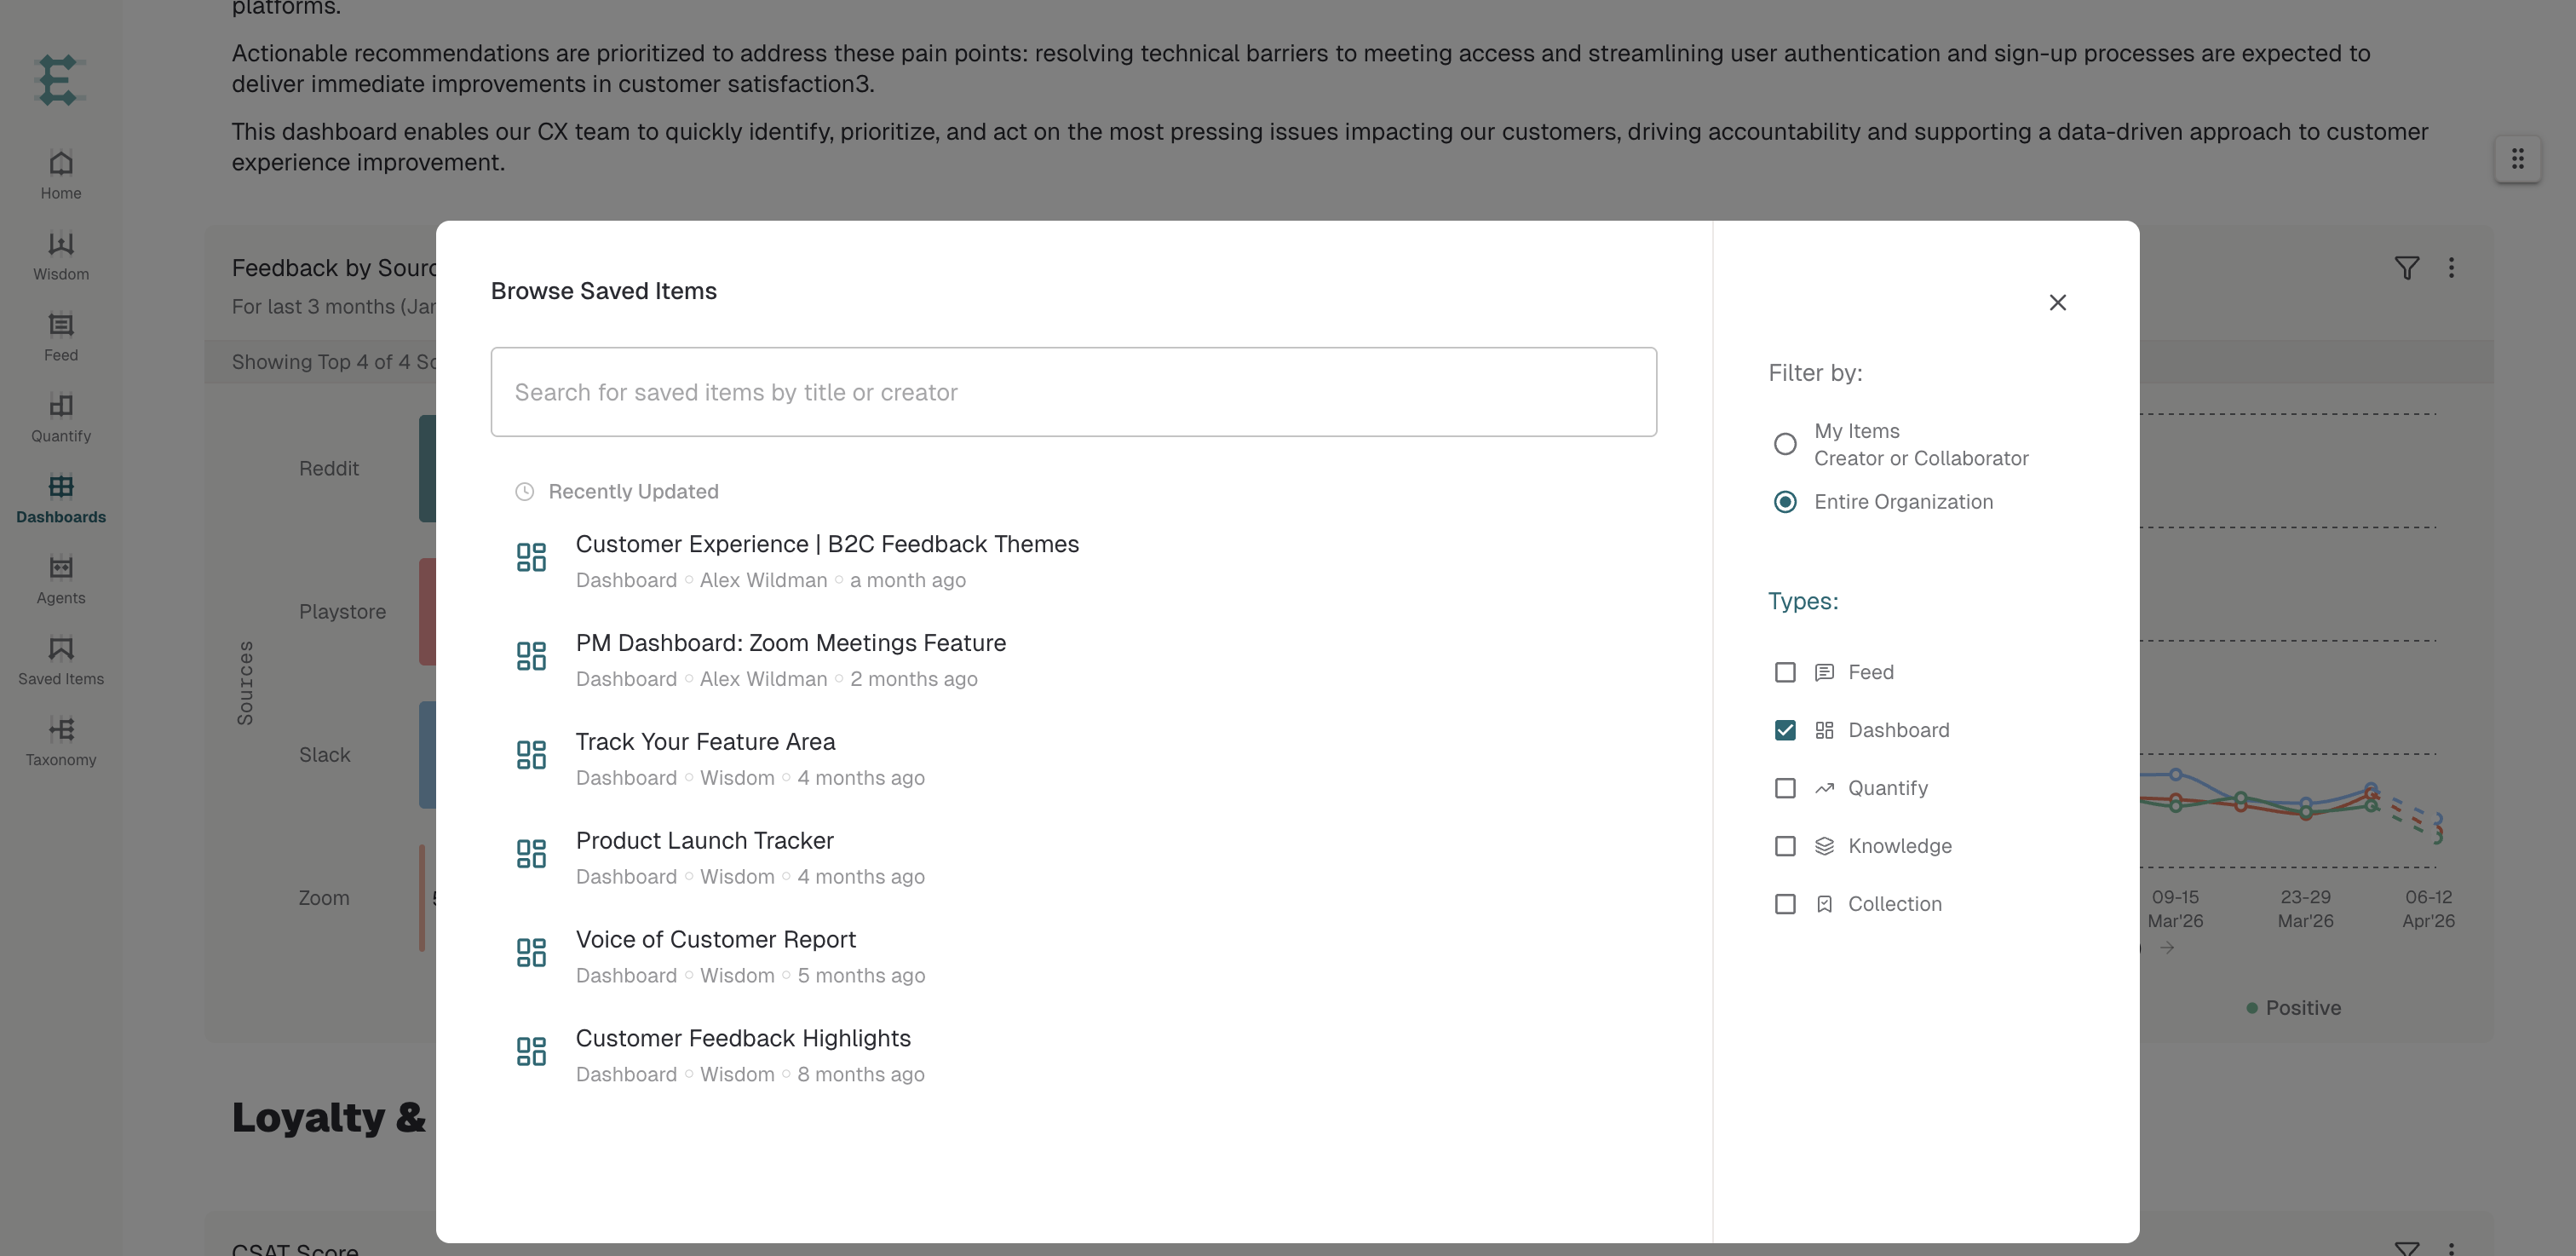
Your Dashboards appear in the list.
How to archive a Dashboard
Archiving a Dashboard removes it from your list and prevents you from finding or editing it. However, anyone who has a viewable link to the Dashboard that was shared before archiving can still view it.
To archive a Dashboard:
Open your Dashboard.
Open the three-dot menu in the Dashboard toolbar.
If you have pinned this Dashboard, unpin it first. Then select Archive Dashboard from the menu.
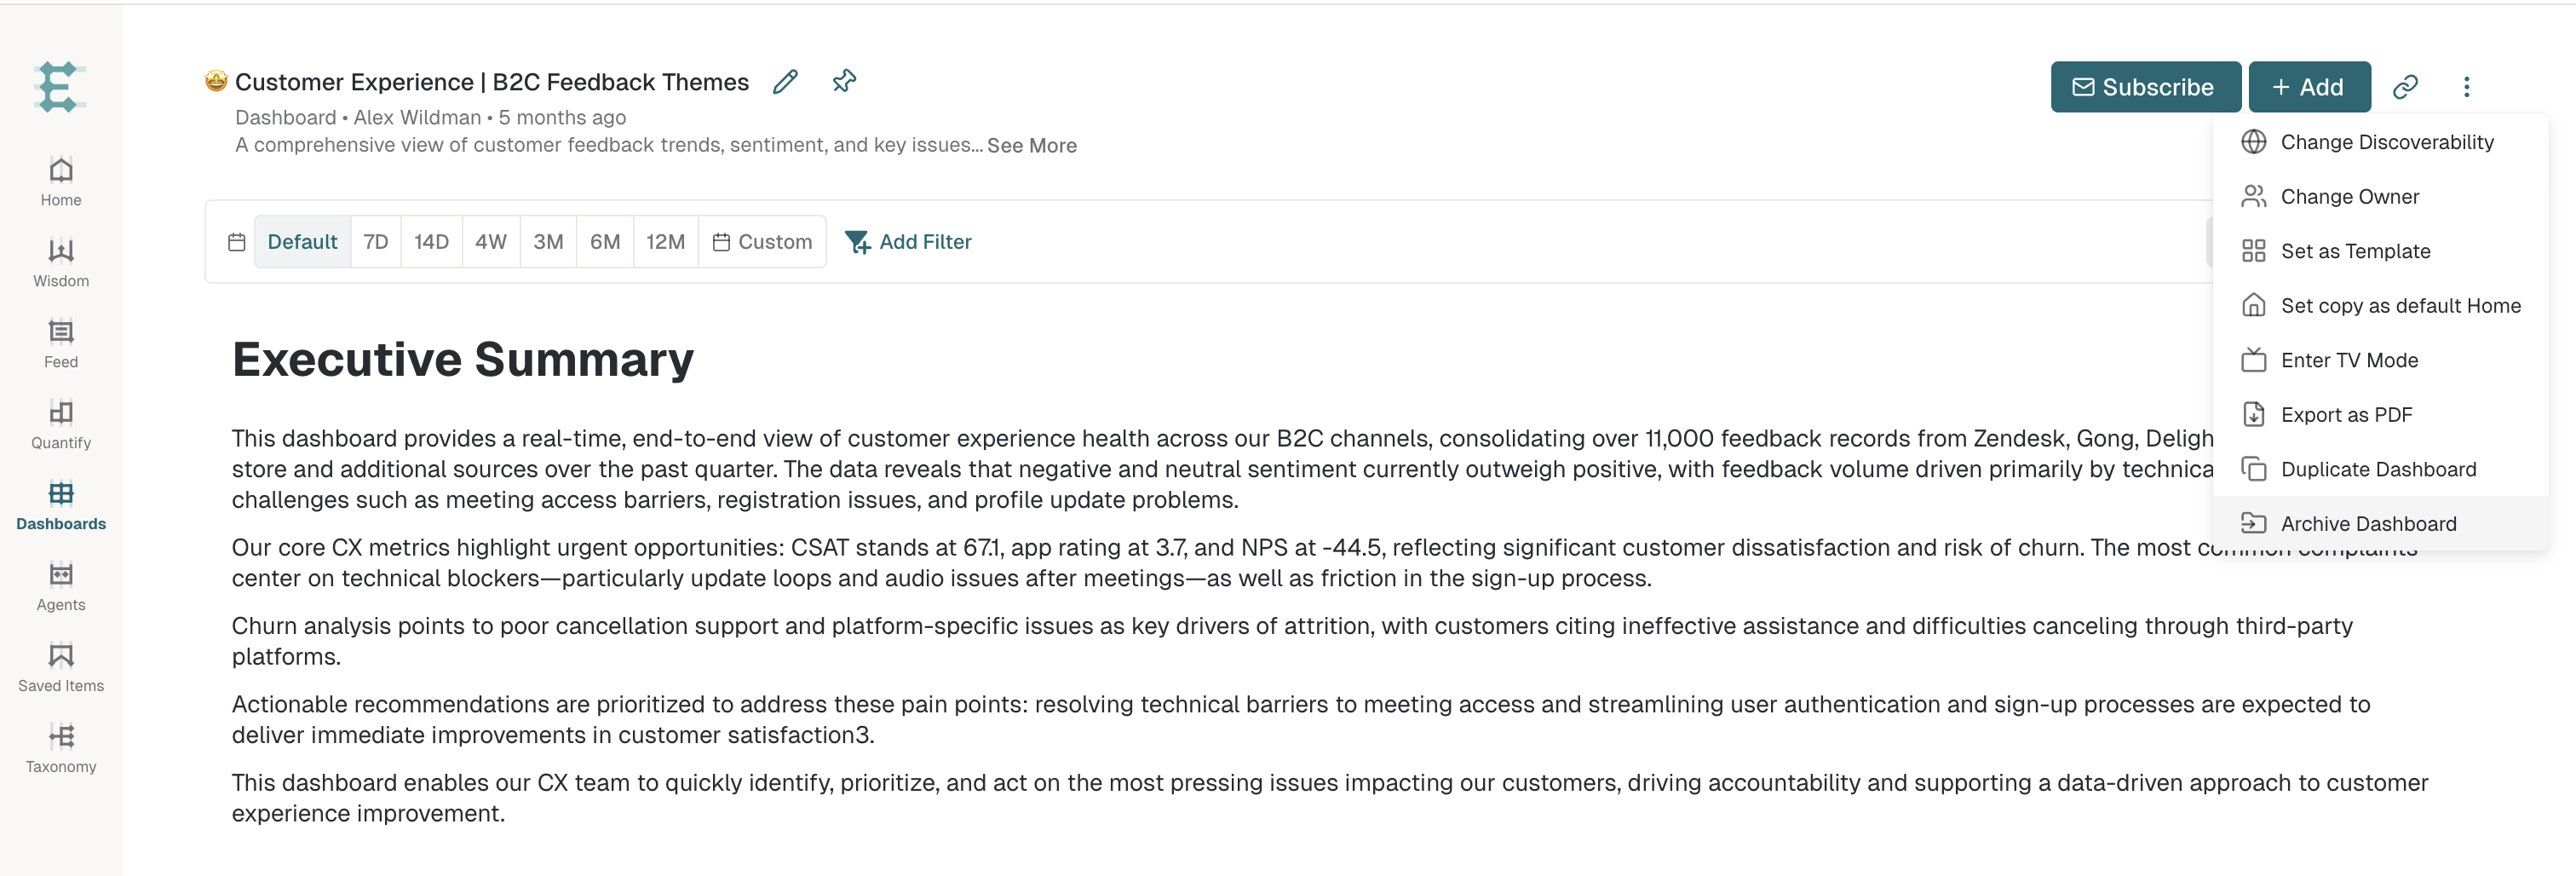
How to stay up to date with your Dashboard
To stay up to date with your Dashboard and receive regular updates, you will need to Subscribe. Dashboard reports can be sent to your email or Slack channels at your chosen frequency. For details, refer to the Dashboard Sharing & Reporting article.
Performance improvements
Dashboard load time depends on its widgets and query scope. If a Dashboard is slow, note the affected widgets and contact your Enterpret team.
For text blocks, dashboard-level filters, removing charts, and collaboration, see Doing More with Dashboards.